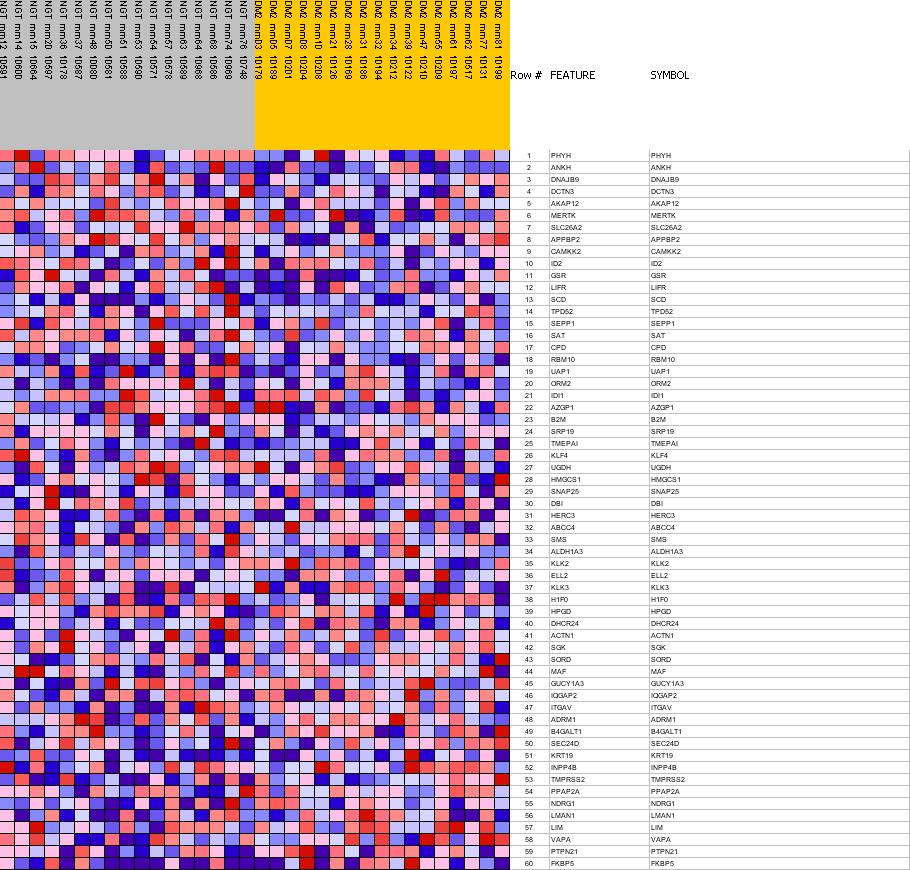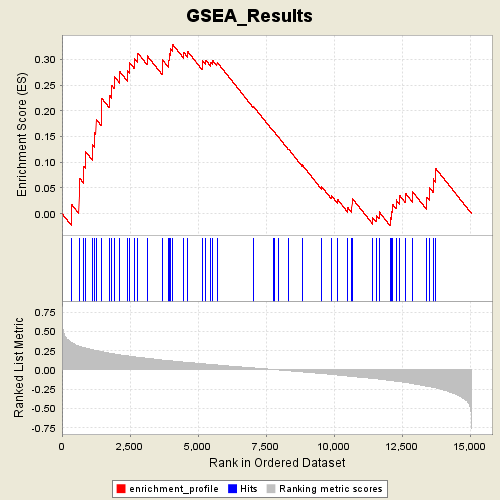
Profile of the Running ES Score & Positions of GeneSet Members on the Rank Ordered List
| Dataset | Diabetes_collapsed.gct |
| Phenotype | NGT |
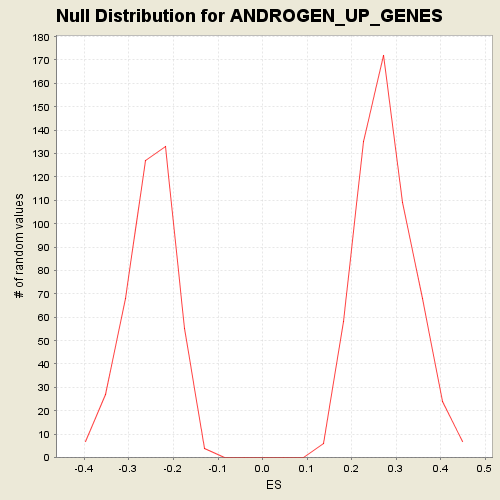
| GeneSet | C2.symbols.gmt#ANDROGEN_UP_GENES |
| Enrichment Score (ES) | 0.32930508 |
| Normalized Enrichment Score (NES) | 1.1961359 |
| Nominal p-value | 0.20034543 |
| FDR q-value | 1.0 |
| FWER p-Value | 1.0 |
| PROBE | GENE SYMBOL | GENE_TITLE | RANK IN GENE LIST | RANK METRIC SCORE | RES | CORE_ENRICHMENT | |
|---|---|---|---|---|---|---|---|
| 1 | PHYH | PHYH StanfordSource, GeneCards | phytanoyl-CoA hydroxylase (Refsum disease) | 340 | 0.359 | 0.0186 | Yes |
| 2 | ANKH | ANKH StanfordSource, GeneCards | ankylosis, progressive homolog (mouse) | 625 | 0.309 | 0.0351 | Yes |
| 3 | DNAJB9 | DNAJB9 StanfordSource, GeneCards | DnaJ (Hsp40) homolog, subfamily B, member 9 | 648 | 0.307 | 0.0689 | Yes |
| 4 | DCTN3 | DCTN3 StanfordSource, GeneCards | dynactin 3 (p22) | 803 | 0.291 | 0.0920 | Yes |
| 5 | AKAP12 | AKAP12 StanfordSource, GeneCards | A kinase (PRKA) anchor protein (gravin) 12 | 874 | 0.284 | 0.1199 | Yes |
| 6 | MERTK | MERTK StanfordSource, GeneCards | c-mer proto-oncogene tyrosine kinase | 1116 | 0.263 | 0.1340 | Yes |
| 7 | SLC26A2 | SLC26A2 StanfordSource, GeneCards | solute carrier family 26 (sulfate transporter), member 2 | 1193 | 0.257 | 0.1584 | Yes |
| 8 | APPBP2 | APPBP2 StanfordSource, GeneCards | amyloid beta precursor protein (cytoplasmic tail) binding protein 2 | 1250 | 0.252 | 0.1836 | Yes |
| 9 | CAMKK2 | CAMKK2 StanfordSource, GeneCards | calcium/calmodulin-dependent protein kinase kinase 2, beta | 1437 | 0.239 | 0.1986 | Yes |
| 10 | ID2 | ID2 StanfordSource, GeneCards | inhibitor of DNA binding 2, dominant negative helix-loop-helix protein | 1456 | 0.237 | 0.2246 | Yes |
| 11 | GSR | GSR StanfordSource, GeneCards | glutathione reductase | 1745 | 0.218 | 0.2304 | Yes |
| 12 | LIFR | LIFR StanfordSource, GeneCards | leukemia inhibitory factor receptor | 1838 | 0.212 | 0.2486 | Yes |
| 13 | SCD | SCD StanfordSource, GeneCards | stearoyl-CoA desaturase (delta-9-desaturase) | 1918 | 0.208 | 0.2673 | Yes |
| 14 | TPD52 | TPD52 StanfordSource, GeneCards | tumor protein D52 | 2128 | 0.196 | 0.2758 | Yes |
| 15 | SEPP1 | SEPP1 StanfordSource, GeneCards | selenoprotein P, plasma, 1 | 2401 | 0.183 | 0.2788 | Yes |
| 16 | SAT | SAT StanfordSource, GeneCards | spermidine/spermine N1-acetyltransferase | 2495 | 0.179 | 0.2931 | Yes |
| 17 | CPD | CPD StanfordSource, GeneCards | carboxypeptidase D | 2654 | 0.171 | 0.3022 | Yes |
| 18 | RBM10 | RBM10 StanfordSource, GeneCards | RNA binding motif protein 10 | 2793 | 0.165 | 0.3120 | Yes |
| 19 | UAP1 | UAP1 StanfordSource, GeneCards | UDP-N-acteylglucosamine pyrophosphorylase 1 | 3126 | 0.151 | 0.3072 | Yes |
| 20 | ORM2 | ORM2 StanfordSource, GeneCards | orosomucoid 2 | 3681 | 0.129 | 0.2851 | Yes |
| 21 | IDI1 | IDI1 StanfordSource, GeneCards | isopentenyl-diphosphate delta isomerase | 3684 | 0.129 | 0.2997 | Yes |
| 22 | AZGP1 | AZGP1 StanfordSource, GeneCards | alpha-2-glycoprotein 1, zinc | 3910 | 0.121 | 0.2986 | Yes |
| 23 | B2M | B2M StanfordSource, GeneCards | beta-2-microglobulin | 3937 | 0.120 | 0.3107 | Yes |
| 24 | SRP19 | SRP19 StanfordSource, GeneCards | signal recognition particle 19kDa | 3983 | 0.119 | 0.3213 | Yes |
| 25 | TMEPAI | TMEPAI StanfordSource, GeneCards | transmembrane, prostate androgen induced RNA | 4065 | 0.116 | 0.3293 | Yes |
| 26 | KLF4 | KLF4 StanfordSource, GeneCards | Kruppel-like factor 4 (gut) | 4482 | 0.102 | 0.3132 | No |
| 27 | UGDH | UGDH StanfordSource, GeneCards | UDP-glucose dehydrogenase | 4617 | 0.098 | 0.3155 | No |
| 28 | HMGCS1 | HMGCS1 StanfordSource, GeneCards | 3-hydroxy-3-methylglutaryl-Coenzyme A synthase 1 (soluble) | 5148 | 0.081 | 0.2895 | No |
| 29 | SNAP25 | SNAP25 StanfordSource, GeneCards | synaptosomal-associated protein, 25kDa | 5178 | 0.080 | 0.2968 | No |
| 30 | DBI | DBI StanfordSource, GeneCards | diazepam binding inhibitor (GABA receptor modulator, acyl-Coenzyme A binding protein) | 5291 | 0.077 | 0.2981 | No |
| 31 | HERC3 | HERC3 StanfordSource, GeneCards | hect domain and RLD 3 | 5472 | 0.071 | 0.2943 | No |
| 32 | ABCC4 | ABCC4 StanfordSource, GeneCards | ATP-binding cassette, sub-family C (CFTR/MRP), member 4 | 5539 | 0.070 | 0.2979 | No |
| 33 | SMS | SMS StanfordSource, GeneCards | spermine synthase | 5699 | 0.065 | 0.2948 | No |
| 34 | ALDH1A3 | ALDH1A3 StanfordSource, GeneCards | aldehyde dehydrogenase 1 family, member A3 | 7034 | 0.027 | 0.2090 | No |
| 35 | KLK2 | KLK2 StanfordSource, GeneCards | kallikrein 2, prostatic | 7780 | 0.006 | 0.1599 | No |
| 36 | ELL2 | ELL2 StanfordSource, GeneCards | elongation factor, RNA polymerase II, 2 | 7824 | 0.004 | 0.1576 | No |
| 37 | KLK3 | KLK3 StanfordSource, GeneCards | kallikrein 3, (prostate specific antigen) | 7959 | 0.001 | 0.1487 | No |
| 38 | H1F0 | H1F0 StanfordSource, GeneCards | H1 histone family, member 0 | 8334 | -0.010 | 0.1250 | No |
| 39 | HPGD | HPGD StanfordSource, GeneCards | hydroxyprostaglandin dehydrogenase 15-(NAD) | 8826 | -0.024 | 0.0950 | No |
| 40 | DHCR24 | DHCR24 StanfordSource, GeneCards | 24-dehydrocholesterol reductase | 9548 | -0.046 | 0.0522 | No |
| 41 | ACTN1 | ACTN1 StanfordSource, GeneCards | actinin, alpha 1 | 9893 | -0.057 | 0.0358 | No |
| 42 | SGK | SGK StanfordSource, GeneCards | serum/glucocorticoid regulated kinase | 10137 | -0.065 | 0.0271 | No |
| 43 | SORD | SORD StanfordSource, GeneCards | sorbitol dehydrogenase | 10510 | -0.079 | 0.0113 | No |
| 44 | MAF | MAF StanfordSource, GeneCards | v-maf musculoaponeurotic fibrosarcoma oncogene homolog (avian) | 10651 | -0.083 | 0.0115 | No |
| 45 | GUCY1A3 | GUCY1A3 StanfordSource, GeneCards | guanylate cyclase 1, soluble, alpha 3 | 10662 | -0.083 | 0.0204 | No |
| 46 | IQGAP2 | IQGAP2 StanfordSource, GeneCards | IQ motif containing GTPase activating protein 2 | 10672 | -0.084 | 0.0294 | No |
| 47 | ITGAV | ITGAV StanfordSource, GeneCards | integrin, alpha V (vitronectin receptor, alpha polypeptide, antigen CD51) | 11423 | -0.110 | -0.0080 | No |
| 48 | ADRM1 | ADRM1 StanfordSource, GeneCards | adhesion regulating molecule 1 | 11546 | -0.115 | -0.0030 | No |
| 49 | B4GALT1 | B4GALT1 StanfordSource, GeneCards | UDP-Gal:betaGlcNAc beta 1,4- galactosyltransferase, polypeptide 1 | 11655 | -0.119 | 0.0035 | No |
| 50 | SEC24D | SEC24D StanfordSource, GeneCards | SEC24 related gene family, member D (S. cerevisiae) | 12070 | -0.136 | -0.0085 | No |
| 51 | KRT19 | KRT19 StanfordSource, GeneCards | keratin 19 | 12125 | -0.138 | 0.0038 | No |
| 52 | INPP4B | INPP4B StanfordSource, GeneCards | inositol polyphosphate-4-phosphatase, type II, 105kDa | 12145 | -0.140 | 0.0185 | No |
| 53 | TMPRSS2 | TMPRSS2 StanfordSource, GeneCards | transmembrane protease, serine 2 | 12280 | -0.146 | 0.0264 | No |
| 54 | PPAP2A | PPAP2A StanfordSource, GeneCards | phosphatidic acid phosphatase type 2A | 12421 | -0.152 | 0.0345 | No |
| 55 | NDRG1 | NDRG1 StanfordSource, GeneCards | N-myc downstream regulated gene 1 | 12619 | -0.162 | 0.0400 | No |
| 56 | LMAN1 | LMAN1 StanfordSource, GeneCards | lectin, mannose-binding, 1 | 12892 | -0.178 | 0.0423 | No |
| 57 | LIM | LIM StanfordSource, GeneCards | LIM protein (similar to rat protein kinase C-binding enigma) | 13417 | -0.211 | 0.0315 | No |
| 58 | VAPA | VAPA StanfordSource, GeneCards | VAMP (vesicle-associated membrane protein)-associated protein A, 33kDa | 13513 | -0.217 | 0.0500 | No |
| 59 | PTPN21 | PTPN21 StanfordSource, GeneCards | protein tyrosine phosphatase, non-receptor type 21 | 13643 | -0.225 | 0.0673 | No |
| 60 | FKBP5 | FKBP5 StanfordSource, GeneCards | FK506 binding protein 5 | 13736 | -0.233 | 0.0880 | No |