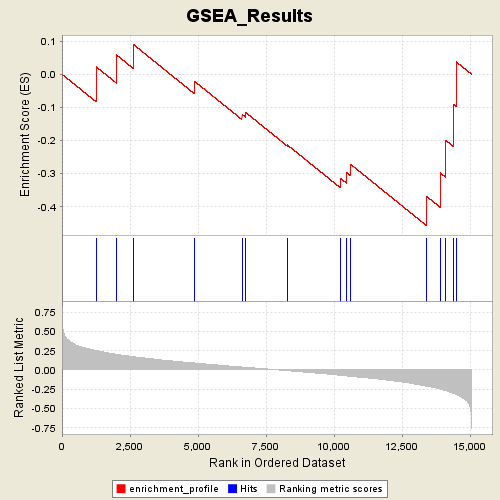
Profile of the Running ES Score & Positions of GeneSet Members on the Rank Ordered List
| Dataset | Diabetes_collapsed.gct |
| Phenotype | DMT |
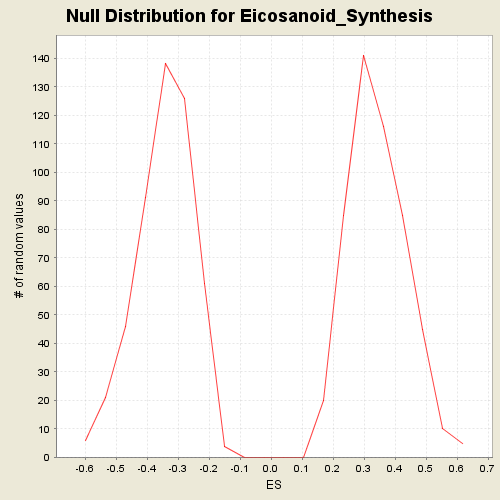
| GeneSet | C2.symbols.gmt#Eicosanoid_Synthesis |
| Enrichment Score (ES) | -0.45849407 |
| Normalized Enrichment Score (NES) | -1.3279905 |
| Nominal p-value | 0.10750507 |
| FDR q-value | 1.0 |
| FWER p-Value | 0.997 |
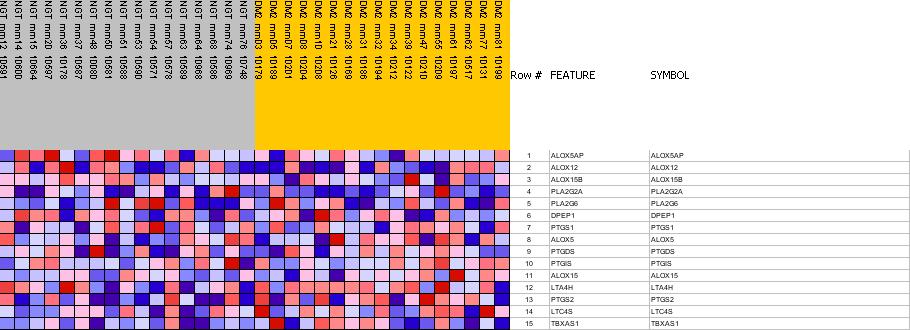
| PROBE | GENE SYMBOL | GENE_TITLE | RANK IN GENE LIST | RANK METRIC SCORE | RES | CORE_ENRICHMENT | |
|---|---|---|---|---|---|---|---|
| 1 | ALOX5AP | ALOX5AP StanfordSource, GeneCards | arachidonate 5-lipoxygenase-activating protein | 1259 | 0.252 | 0.0224 | No |
| 2 | ALOX12 | ALOX12 StanfordSource, GeneCards | arachidonate 12-lipoxygenase | 2005 | 0.203 | 0.0583 | No |
| 3 | ALOX15B | ALOX15B StanfordSource, GeneCards | arachidonate 15-lipoxygenase, second type | 2618 | 0.173 | 0.0905 | No |
| 4 | PLA2G2A | PLA2G2A StanfordSource, GeneCards | phospholipase A2, group IIA (platelets, synovial fluid) | 4866 | 0.090 | -0.0209 | No |
| 5 | PLA2G6 | PLA2G6 StanfordSource, GeneCards | phospholipase A2, group VI (cytosolic, calcium-independent) | 6618 | 0.038 | -0.1211 | No |
| 6 | DPEP1 | DPEP1 StanfordSource, GeneCards | dipeptidase 1 (renal) | 6764 | 0.034 | -0.1163 | No |
| 7 | PTGS1 | PTGS1 StanfordSource, GeneCards | prostaglandin-endoperoxide synthase 1 (prostaglandin G/H synthase and cyclooxygenase) | 8279 | -0.009 | -0.2133 | No |
| 8 | ALOX5 | ALOX5 StanfordSource, GeneCards | arachidonate 5-lipoxygenase | 10231 | -0.069 | -0.3140 | No |
| 9 | PTGDS | PTGDS StanfordSource, GeneCards | prostaglandin D2 synthase 21kDa (brain) | 10471 | -0.077 | -0.2973 | No |
| 10 | PTGIS | PTGIS StanfordSource, GeneCards | prostaglandin I2 (prostacyclin) synthase | 10613 | -0.082 | -0.2723 | No |
| 11 | ALOX15 | ALOX15 StanfordSource, GeneCards | arachidonate 15-lipoxygenase | 13415 | -0.211 | -0.3697 | Yes |
| 12 | LTA4H | LTA4H StanfordSource, GeneCards | leukotriene A4 hydrolase | 13902 | -0.247 | -0.2980 | Yes |
| 13 | PTGS2 | PTGS2 StanfordSource, GeneCards | prostaglandin-endoperoxide synthase 2 (prostaglandin G/H synthase and cyclooxygenase) | 14101 | -0.266 | -0.1990 | Yes |
| 14 | LTC4S | LTC4S StanfordSource, GeneCards | leukotriene C4 synthase | 14401 | -0.305 | -0.0906 | Yes |
| 15 | TBXAS1 | TBXAS1 StanfordSource, GeneCards | thromboxane A synthase 1 (platelet, cytochrome P450, family 5, subfamily A) | 14498 | -0.318 | 0.0370 | Yes |