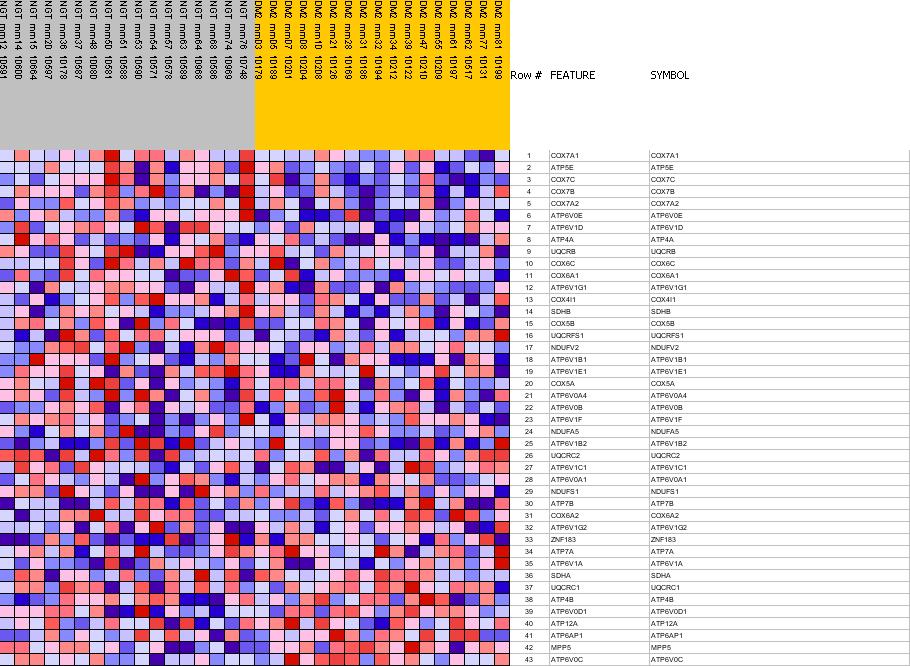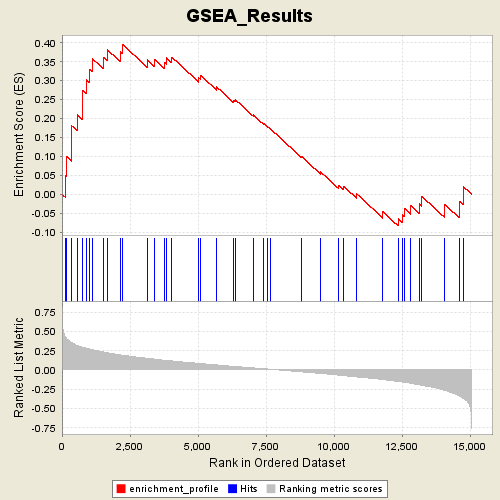
Profile of the Running ES Score & Positions of GeneSet Members on the Rank Ordered List
| Dataset | Diabetes_collapsed.gct |
| Phenotype | NGT |
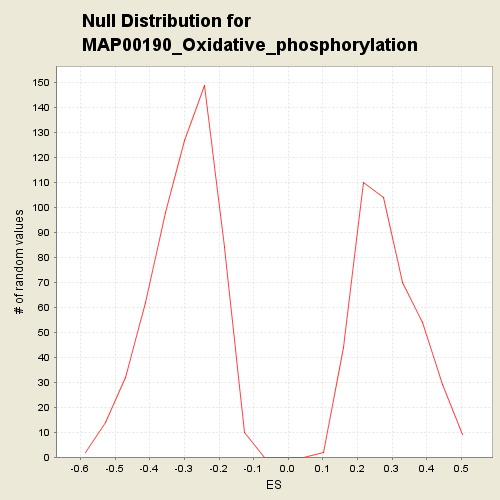
| GeneSet | C2.symbols.gmt#MAP00190_Oxidative_phosphorylation |
| Enrichment Score (ES) | 0.3955165 |
| Normalized Enrichment Score (NES) | 1.3786291 |
| Nominal p-value | 0.1492891 |
| FDR q-value | 1.0 |
| FWER p-Value | 0.994 |
| PROBE | GENE SYMBOL | GENE_TITLE | RANK IN GENE LIST | RANK METRIC SCORE | RES | CORE_ENRICHMENT | |
|---|---|---|---|---|---|---|---|
| 1 | COX7A1 | COX7A1 StanfordSource, GeneCards | cytochrome c oxidase subunit VIIa polypeptide 1 (muscle) | 123 | 0.432 | 0.0488 | Yes |
| 2 | ATP5E | ATP5E StanfordSource, GeneCards | ATP synthase, H+ transporting, mitochondrial F1 complex, epsilon subunit | 159 | 0.409 | 0.1004 | Yes |
| 3 | COX7C | COX7C StanfordSource, GeneCards | cytochrome c oxidase subunit VIIc | 363 | 0.353 | 0.1335 | Yes |
| 4 | COX7B | COX7B StanfordSource, GeneCards | cytochrome c oxidase subunit VIIb | 366 | 0.353 | 0.1799 | Yes |
| 5 | COX7A2 | COX7A2 StanfordSource, GeneCards | cytochrome c oxidase subunit VIIa polypeptide 2 (liver) | 557 | 0.317 | 0.2091 | Yes |
| 6 | ATP6V0E | ATP6V0E StanfordSource, GeneCards | ATPase, H+ transporting, lysosomal 9kDa, V0 subunit e | 753 | 0.295 | 0.2351 | Yes |
| 7 | ATP6V1D | ATP6V1D StanfordSource, GeneCards | ATPase, H+ transporting, lysosomal 34kDa, V1 subunit D | 770 | 0.294 | 0.2728 | Yes |
| 8 | ATP4A | ATP4A StanfordSource, GeneCards | ATPase, H+/K+ exchanging, alpha polypeptide | 885 | 0.283 | 0.3026 | Yes |
| 9 | UQCRB | UQCRB StanfordSource, GeneCards | ubiquinol-cytochrome c reductase binding protein | 1022 | 0.270 | 0.3292 | Yes |
| 10 | COX6C | COX6C StanfordSource, GeneCards | cytochrome c oxidase subunit VIc | 1115 | 0.263 | 0.3577 | Yes |
| 11 | COX6A1 | COX6A1 StanfordSource, GeneCards | cytochrome c oxidase subunit VIa polypeptide 1 | 1520 | 0.233 | 0.3616 | Yes |
| 12 | ATP6V1G1 | ATP6V1G1 StanfordSource, GeneCards | ATPase, H+ transporting, lysosomal 13kDa, V1 subunit G isoform 1 | 1662 | 0.222 | 0.3815 | Yes |
| 13 | COX4I1 | COX4I1 StanfordSource, GeneCards | cytochrome c oxidase subunit IV isoform 1 | 2139 | 0.196 | 0.3757 | Yes |
| 14 | SDHB | SDHB StanfordSource, GeneCards | succinate dehydrogenase complex, subunit B, iron sulfur (Ip) | 2222 | 0.192 | 0.3955 | Yes |
| 15 | COX5B | COX5B StanfordSource, GeneCards | cytochrome c oxidase subunit Vb | 3139 | 0.150 | 0.3544 | No |
| 16 | UQCRFS1 | UQCRFS1 StanfordSource, GeneCards | ubiquinol-cytochrome c reductase, Rieske iron-sulfur polypeptide 1 | 3411 | 0.141 | 0.3549 | No |
| 17 | NDUFV2 | NDUFV2 StanfordSource, GeneCards | NADH dehydrogenase (ubiquinone) flavoprotein 2, 24kDa | 3775 | 0.125 | 0.3472 | No |
| 18 | ATP6V1B1 | ATP6V1B1 StanfordSource, GeneCards | ATPase, H+ transporting, lysosomal 56/58kDa, V1 subunit B, isoform 1 (Renal tubular acidosis with deafness) | 3833 | 0.124 | 0.3597 | No |
| 19 | ATP6V1E1 | ATP6V1E1 StanfordSource, GeneCards | ATPase, H+ transporting, lysosomal 31kDa, V1 subunit E isoform 1 | 4038 | 0.117 | 0.3616 | No |
| 20 | COX5A | COX5A StanfordSource, GeneCards | cytochrome c oxidase subunit Va | 5029 | 0.086 | 0.3070 | No |
| 21 | ATP6V0A4 | ATP6V0A4 StanfordSource, GeneCards | ATPase, H+ transporting, lysosomal V0 subunit a isoform 4 | 5090 | 0.084 | 0.3140 | No |
| 22 | ATP6V0B | ATP6V0B StanfordSource, GeneCards | ATPase, H+ transporting, lysosomal 21kDa, V0 subunit c'' | 5681 | 0.066 | 0.2834 | No |
| 23 | ATP6V1F | ATP6V1F StanfordSource, GeneCards | ATPase, H+ transporting, lysosomal 14kDa, V1 subunit F | 6308 | 0.046 | 0.2479 | No |
| 24 | NDUFA5 | NDUFA5 StanfordSource, GeneCards | NADH dehydrogenase (ubiquinone) 1 alpha subcomplex, 5, 13kDa | 6374 | 0.045 | 0.2495 | No |
| 25 | ATP6V1B2 | ATP6V1B2 StanfordSource, GeneCards | ATPase, H+ transporting, lysosomal 56/58kDa, V1 subunit B, isoform 2 | 7032 | 0.027 | 0.2093 | No |
| 26 | UQCRC2 | UQCRC2 StanfordSource, GeneCards | ubiquinol-cytochrome c reductase core protein II | 7403 | 0.016 | 0.1868 | No |
| 27 | ATP6V1C1 | ATP6V1C1 StanfordSource, GeneCards | ATPase, H+ transporting, lysosomal 42kDa, V1 subunit C, isoform 1 | 7548 | 0.013 | 0.1789 | No |
| 28 | ATP6V0A1 | ATP6V0A1 StanfordSource, GeneCards | ATPase, H+ transporting, lysosomal V0 subunit a isoform 1 | 7674 | 0.009 | 0.1718 | No |
| 29 | NDUFS1 | NDUFS1 StanfordSource, GeneCards | NADH dehydrogenase (ubiquinone) Fe-S protein 1, 75kDa (NADH-coenzyme Q reductase) | 8811 | -0.024 | 0.0992 | No |
| 30 | ATP7B | ATP7B StanfordSource, GeneCards | ATPase, Cu++ transporting, beta polypeptide (Wilson disease) | 9506 | -0.045 | 0.0589 | No |
| 31 | COX6A2 | COX6A2 StanfordSource, GeneCards | cytochrome c oxidase subunit VIa polypeptide 2 | 10177 | -0.067 | 0.0231 | No |
| 32 | ATP6V1G2 | ATP6V1G2 StanfordSource, GeneCards | ATPase, H+ transporting, lysosomal 13kDa, V1 subunit G isoform 2 | 10349 | -0.073 | 0.0213 | No |
| 33 | ZNF183 | ZNF183 StanfordSource, GeneCards | zinc finger protein 183 (RING finger, C3HC4 type) | 10835 | -0.090 | 0.0009 | No |
| 34 | ATP7A | ATP7A StanfordSource, GeneCards | ATPase, Cu++ transporting, alpha polypeptide (Menkes syndrome) | 11798 | -0.125 | -0.0467 | No |
| 35 | ATP6V1A | ATP6V1A StanfordSource, GeneCards | ATPase, H+ transporting, lysosomal 70kDa, V1 subunit A | 12357 | -0.149 | -0.0641 | No |
| 36 | SDHA | SDHA StanfordSource, GeneCards | succinate dehydrogenase complex, subunit A, flavoprotein (Fp) | 12501 | -0.156 | -0.0531 | No |
| 37 | UQCRC1 | UQCRC1 StanfordSource, GeneCards | ubiquinol-cytochrome c reductase core protein I | 12601 | -0.161 | -0.0384 | No |
| 38 | ATP4B | ATP4B StanfordSource, GeneCards | ATPase, H+/K+ exchanging, beta polypeptide | 12823 | -0.173 | -0.0303 | No |
| 39 | ATP6V0D1 | ATP6V0D1 StanfordSource, GeneCards | ATPase, H+ transporting, lysosomal 38kDa, V0 subunit d isoform 1 | 13131 | -0.192 | -0.0254 | No |
| 40 | ATP12A | ATP12A StanfordSource, GeneCards | ATPase, H+/K+ transporting, nongastric, alpha polypeptide | 13224 | -0.198 | -0.0054 | No |
| 41 | ATP6AP1 | ATP6AP1 StanfordSource, GeneCards | ATPase, H+ transporting, lysosomal accessory protein 1 | 14074 | -0.264 | -0.0272 | No |
| 42 | MPP5 | MPP5 StanfordSource, GeneCards | membrane protein, palmitoylated 5 (MAGUK p55 subfamily member 5) | 14606 | -0.335 | -0.0183 | No |
| 43 | ATP6V0C | ATP6V0C StanfordSource, GeneCards | ATPase, H+ transporting, lysosomal 16kDa, V0 subunit c | 14745 | -0.365 | 0.0206 | No |