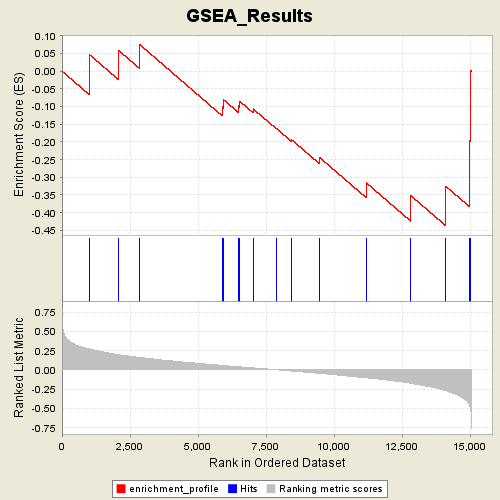
Profile of the Running ES Score & Positions of GeneSet Members on the Rank Ordered List
| Dataset | Diabetes_collapsed.gct |
| Phenotype | DMT |
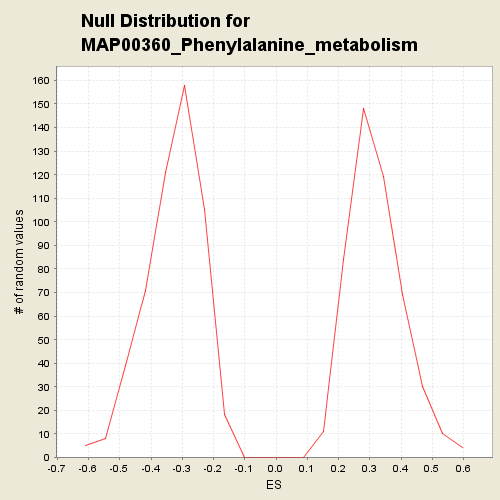
| GeneSet | C2.symbols.gmt#MAP00360_Phenylalanine_metabolism |
| Enrichment Score (ES) | -0.4377382 |
| Normalized Enrichment Score (NES) | -1.3392274 |
| Nominal p-value | 0.11809524 |
| FDR q-value | 1.0 |
| FWER p-Value | 0.997 |
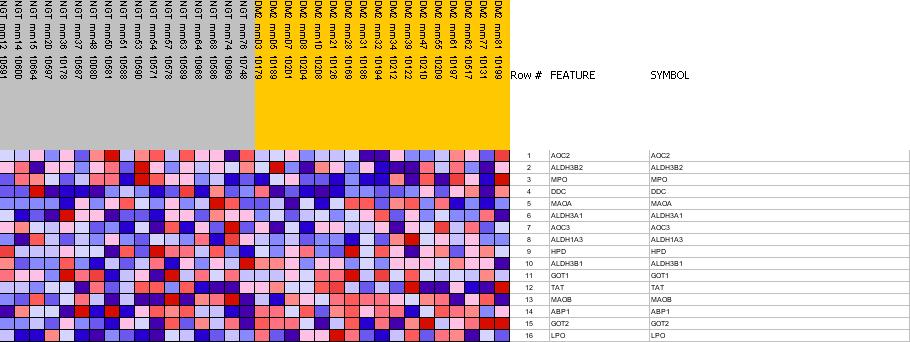
| PROBE | GENE SYMBOL | GENE_TITLE | RANK IN GENE LIST | RANK METRIC SCORE | RES | CORE_ENRICHMENT | |
|---|---|---|---|---|---|---|---|
| 1 | AOC2 | AOC2 StanfordSource, GeneCards | amine oxidase, copper containing 2 (retina-specific) | 999 | 0.273 | 0.0475 | No |
| 2 | ALDH3B2 | ALDH3B2 StanfordSource, GeneCards | aldehyde dehydrogenase 3 family, member B2 | 2074 | 0.199 | 0.0591 | No |
| 3 | MPO | MPO StanfordSource, GeneCards | myeloperoxidase | 2847 | 0.163 | 0.0759 | No |
| 4 | DDC | DDC StanfordSource, GeneCards | dopa decarboxylase (aromatic L-amino acid decarboxylase) | 5886 | 0.060 | -0.1012 | No |
| 5 | MAOA | MAOA StanfordSource, GeneCards | monoamine oxidase A | 5951 | 0.057 | -0.0814 | No |
| 6 | ALDH3A1 | ALDH3A1 StanfordSource, GeneCards | aldehyde dehydrogenase 3 family, memberA1 | 6474 | 0.043 | -0.0984 | No |
| 7 | AOC3 | AOC3 StanfordSource, GeneCards | amine oxidase, copper containing 3 (vascular adhesion protein 1) | 6533 | 0.041 | -0.0851 | No |
| 8 | ALDH1A3 | ALDH1A3 StanfordSource, GeneCards | aldehyde dehydrogenase 1 family, member A3 | 7034 | 0.027 | -0.1071 | No |
| 9 | HPD | HPD StanfordSource, GeneCards | 4-hydroxyphenylpyruvate dioxygenase | 7882 | 0.003 | -0.1621 | No |
| 10 | ALDH3B1 | ALDH3B1 StanfordSource, GeneCards | aldehyde dehydrogenase 3 family, member B1 | 8429 | -0.013 | -0.1931 | No |
| 11 | GOT1 | GOT1 StanfordSource, GeneCards | glutamic-oxaloacetic transaminase 1, soluble (aspartate aminotransferase 1) | 9465 | -0.043 | -0.2438 | No |
| 12 | TAT | TAT StanfordSource, GeneCards | tyrosine aminotransferase | 11185 | -0.102 | -0.3156 | No |
| 13 | MAOB | MAOB StanfordSource, GeneCards | monoamine oxidase B | 12825 | -0.173 | -0.3521 | No |
| 14 | ABP1 | ABP1 StanfordSource, GeneCards | amiloride binding protein 1 (amine oxidase (copper-containing)) | 14114 | -0.268 | -0.3258 | Yes |
| 15 | GOT2 | GOT2 StanfordSource, GeneCards | glutamic-oxaloacetic transaminase 2, mitochondrial (aspartate aminotransferase 2) | 14968 | -0.444 | -0.1972 | Yes |
| 16 | LPO | LPO StanfordSource, GeneCards | lactoperoxidase | 15009 | -0.486 | 0.0031 | Yes |