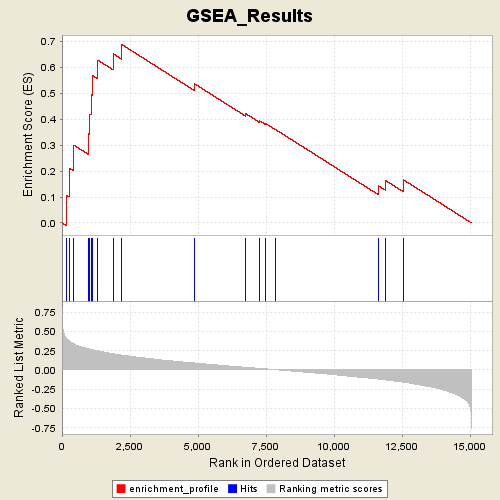
Profile of the Running ES Score & Positions of GeneSet Members on the Rank Ordered List
| Dataset | Diabetes_collapsed.gct |
| Phenotype | NGT |
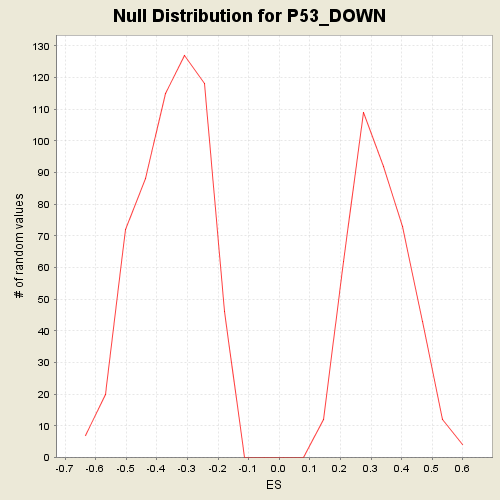
| GeneSet | C2.symbols.gmt#P53_DOWN |
| Enrichment Score (ES) | 0.6885681 |
| Normalized Enrichment Score (NES) | 2.0942564 |
| Nominal p-value | 0.0 |
| FDR q-value | 0.008999617 |
| FWER p-Value | 0.011 |
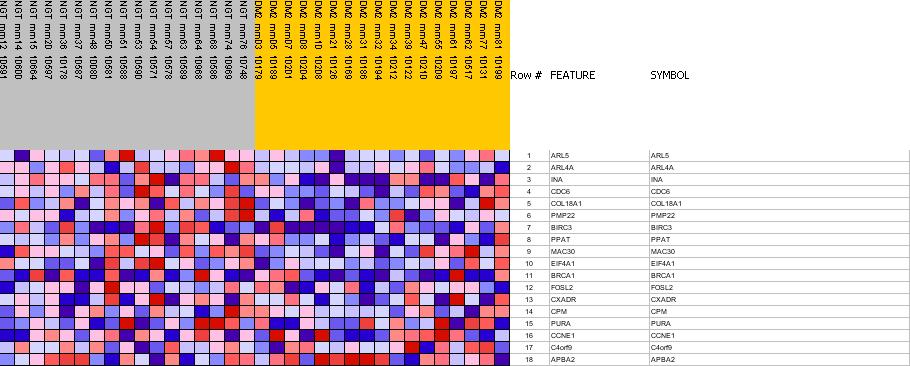
| PROBE | GENE SYMBOL | GENE_TITLE | RANK IN GENE LIST | RANK METRIC SCORE | RES | CORE_ENRICHMENT | |
|---|---|---|---|---|---|---|---|
| 1 | ARL5 | ARL5 StanfordSource, GeneCards | ADP-ribosylation factor-like 5 | 172 | 0.404 | 0.1068 | Yes |
| 2 | ARL4A | ARL4A StanfordSource, GeneCards | ADP-ribosylation factor-like 4A | 265 | 0.378 | 0.2116 | Yes |
| 3 | INA | INA StanfordSource, GeneCards | internexin neuronal intermediate filament protein, alpha | 429 | 0.339 | 0.3002 | Yes |
| 4 | CDC6 | CDC6 StanfordSource, GeneCards | CDC6 cell division cycle 6 homolog (S. cerevisiae) | 992 | 0.273 | 0.3429 | Yes |
| 5 | COL18A1 | COL18A1 StanfordSource, GeneCards | collagen, type XVIII, alpha 1 | 1027 | 0.270 | 0.4197 | Yes |
| 6 | PMP22 | PMP22 StanfordSource, GeneCards | peripheral myelin protein 22 | 1082 | 0.265 | 0.4939 | Yes |
| 7 | BIRC3 | BIRC3 StanfordSource, GeneCards | baculoviral IAP repeat-containing 3 | 1130 | 0.261 | 0.5674 | Yes |
| 8 | PPAT | PPAT StanfordSource, GeneCards | phosphoribosyl pyrophosphate amidotransferase | 1315 | 0.248 | 0.6278 | Yes |
| 9 | MAC30 | MAC30 StanfordSource, GeneCards | hypothetical protein MAC30 | 1878 | 0.210 | 0.6521 | Yes |
| 10 | EIF4A1 | EIF4A1 StanfordSource, GeneCards | eukaryotic translation initiation factor 4A, isoform 1 | 2184 | 0.194 | 0.6886 | Yes |
| 11 | BRCA1 | BRCA1 StanfordSource, GeneCards | breast cancer 1, early onset | 4861 | 0.090 | 0.5371 | No |
| 12 | FOSL2 | FOSL2 StanfordSource, GeneCards | FOS-like antigen 2 | 6750 | 0.035 | 0.4218 | No |
| 13 | CXADR | CXADR StanfordSource, GeneCards | coxsackie virus and adenovirus receptor | 7256 | 0.021 | 0.3942 | No |
| 14 | CPM | CPM StanfordSource, GeneCards | carboxypeptidase M | 7466 | 0.015 | 0.3846 | No |
| 15 | PURA | PURA StanfordSource, GeneCards | purine-rich element binding protein A | 7862 | 0.004 | 0.3594 | No |
| 16 | CCNE1 | CCNE1 StanfordSource, GeneCards | cyclin E1 | 11635 | -0.118 | 0.1432 | No |
| 17 | C4orf9 | C4orf9 StanfordSource, GeneCards | chromosome 4 open reading frame 9 | 11882 | -0.128 | 0.1645 | No |
| 18 | APBA2 | APBA2 StanfordSource, GeneCards | amyloid beta (A4) precursor protein-binding, family A, member 2 (X11-like) | 12552 | -0.159 | 0.1664 | No |