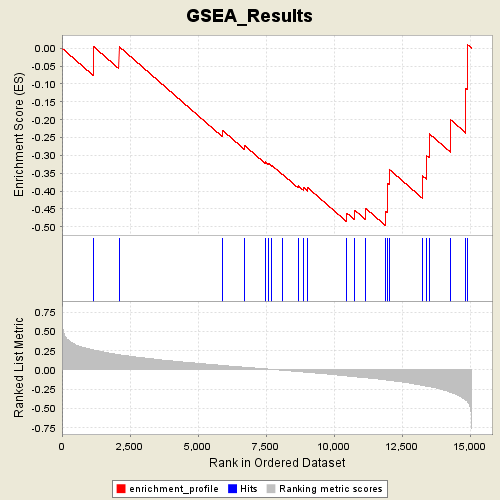
Profile of the Running ES Score & Positions of GeneSet Members on the Rank Ordered List
| Dataset | Diabetes_collapsed.gct |
| Phenotype | DMT |
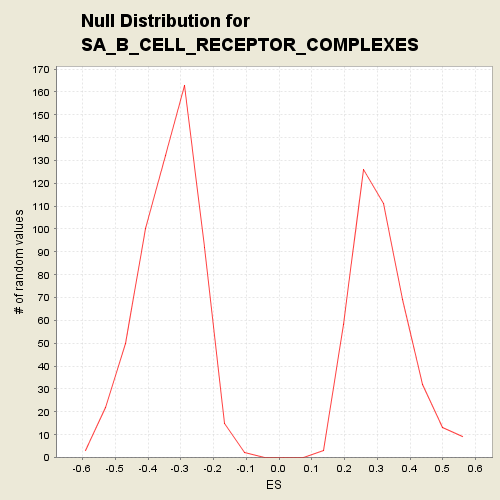
| GeneSet | C2.symbols.gmt#SA_B_CELL_RECEPTOR_COMPLEXES |
| Enrichment Score (ES) | -0.49740076 |
| Normalized Enrichment Score (NES) | -1.4827924 |
| Nominal p-value | 0.04317789 |
| FDR q-value | 1.0 |
| FWER p-Value | 0.954 |
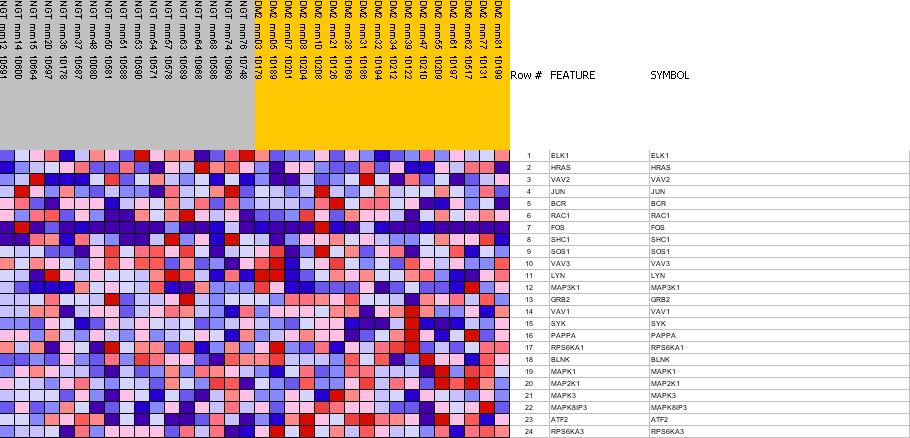
| PROBE | GENE SYMBOL | GENE_TITLE | RANK IN GENE LIST | RANK METRIC SCORE | RES | CORE_ENRICHMENT | |
|---|---|---|---|---|---|---|---|
| 1 | ELK1 | ELK1 StanfordSource, GeneCards | ELK1, member of ETS oncogene family | 1168 | 0.259 | 0.0040 | No |
| 2 | HRAS | HRAS StanfordSource, GeneCards | v-Ha-ras Harvey rat sarcoma viral oncogene homolog | 2096 | 0.198 | 0.0047 | No |
| 3 | VAV2 | VAV2 StanfordSource, GeneCards | vav 2 oncogene | 5900 | 0.059 | -0.2296 | No |
| 4 | JUN | JUN StanfordSource, GeneCards | v-jun sarcoma virus 17 oncogene homolog (avian) | 6697 | 0.036 | -0.2711 | No |
| 5 | BCR | BCR StanfordSource, GeneCards | breakpoint cluster region | 7469 | 0.015 | -0.3177 | No |
| 6 | RAC1 | RAC1 StanfordSource, GeneCards | ras-related C3 botulinum toxin substrate 1 (rho family, small GTP binding protein Rac1) | 7596 | 0.011 | -0.3226 | No |
| 7 | FOS | FOS StanfordSource, GeneCards | v-fos FBJ murine osteosarcoma viral oncogene homolog | 7712 | 0.008 | -0.3278 | No |
| 8 | SHC1 | SHC1 StanfordSource, GeneCards | SHC (Src homology 2 domain containing) transforming protein 1 | 8103 | -0.003 | -0.3527 | No |
| 9 | SOS1 | SOS1 StanfordSource, GeneCards | son of sevenless homolog 1 (Drosophila) | 8678 | -0.020 | -0.3846 | No |
| 10 | VAV3 | VAV3 StanfordSource, GeneCards | vav 3 oncogene | 8869 | -0.026 | -0.3891 | No |
| 11 | LYN | LYN StanfordSource, GeneCards | v-yes-1 Yamaguchi sarcoma viral related oncogene homolog | 9043 | -0.031 | -0.3909 | No |
| 12 | MAP3K1 | MAP3K1 StanfordSource, GeneCards | mitogen-activated protein kinase kinase kinase 1 | 10474 | -0.077 | -0.4616 | No |
| 13 | GRB2 | GRB2 StanfordSource, GeneCards | growth factor receptor-bound protein 2 | 10756 | -0.087 | -0.4529 | No |
| 14 | VAV1 | VAV1 StanfordSource, GeneCards | vav 1 oncogene | 11162 | -0.101 | -0.4479 | No |
| 15 | SYK | SYK StanfordSource, GeneCards | spleen tyrosine kinase | 11907 | -0.129 | -0.4566 | Yes |
| 16 | PAPPA | PAPPA StanfordSource, GeneCards | pregnancy-associated plasma protein A | 11952 | -0.131 | -0.4180 | Yes |
| 17 | RPS6KA1 | RPS6KA1 StanfordSource, GeneCards | ribosomal protein S6 kinase, 90kDa, polypeptide 1 | 11973 | -0.132 | -0.3776 | Yes |
| 18 | BLNK | BLNK StanfordSource, GeneCards | B-cell linker | 12039 | -0.134 | -0.3396 | Yes |
| 19 | MAPK1 | MAPK1 StanfordSource, GeneCards | mitogen-activated protein kinase 1 | 13258 | -0.200 | -0.3574 | Yes |
| 20 | MAP2K1 | MAP2K1 StanfordSource, GeneCards | mitogen-activated protein kinase kinase 1 | 13396 | -0.210 | -0.3003 | Yes |
| 21 | MAPK3 | MAPK3 StanfordSource, GeneCards | mitogen-activated protein kinase 3 | 13499 | -0.216 | -0.2389 | Yes |
| 22 | MAPK8IP3 | MAPK8IP3 StanfordSource, GeneCards | mitogen-activated protein kinase 8 interacting protein 3 | 14282 | -0.289 | -0.1998 | Yes |
| 23 | ATF2 | ATF2 StanfordSource, GeneCards | activating transcription factor 2 | 14850 | -0.392 | -0.1138 | Yes |
| 24 | RPS6KA3 | RPS6KA3 StanfordSource, GeneCards | ribosomal protein S6 kinase, 90kDa, polypeptide 3 | 14892 | -0.403 | 0.0108 | Yes |