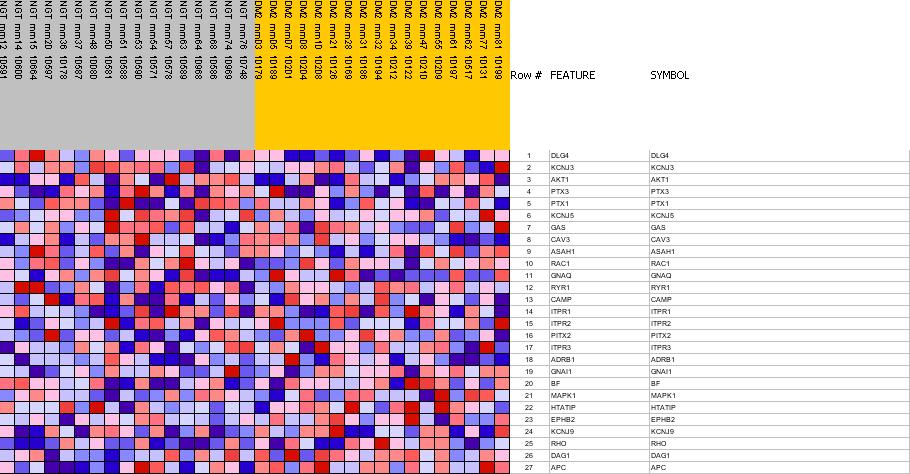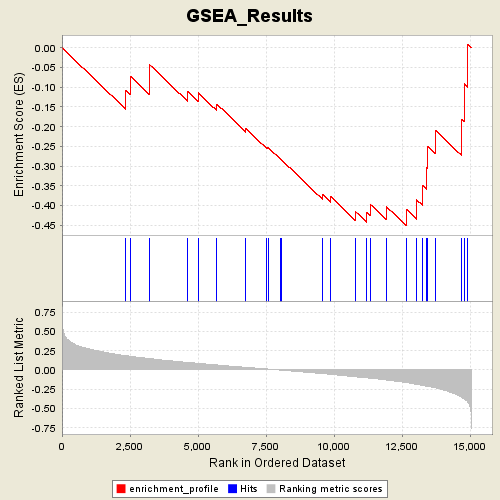
Profile of the Running ES Score & Positions of GeneSet Members on the Rank Ordered List
| Dataset | Diabetes_collapsed.gct |
| Phenotype | DMT |
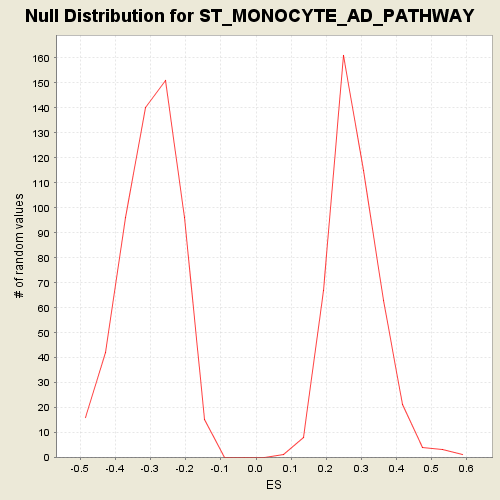
| GeneSet | C2.symbols.gmt#ST_MONOCYTE_AD_PATHWAY |
| Enrichment Score (ES) | -0.45189694 |
| Normalized Enrichment Score (NES) | -1.5106812 |
| Nominal p-value | 0.035971224 |
| FDR q-value | 1.0 |
| FWER p-Value | 0.941 |
| PROBE | GENE SYMBOL | GENE_TITLE | RANK IN GENE LIST | RANK METRIC SCORE | RES | CORE_ENRICHMENT | |
|---|---|---|---|---|---|---|---|
| 1 | DLG4 | DLG4 StanfordSource, GeneCards | discs, large homolog 4 (Drosophila) | 2342 | 0.186 | -0.1075 | No |
| 2 | KCNJ3 | KCNJ3 StanfordSource, GeneCards | potassium inwardly-rectifying channel, subfamily J, member 3 | 2521 | 0.178 | -0.0732 | No |
| 3 | AKT1 | AKT1 StanfordSource, GeneCards | v-akt murine thymoma viral oncogene homolog 1 | 3210 | 0.148 | -0.0806 | No |
| 4 | PTX3 | PTX3 StanfordSource, GeneCards | pentaxin-related gene, rapidly induced by IL-1 beta | 3222 | 0.147 | -0.0431 | No |
| 5 | PTX1 | PTX1 StanfordSource, GeneCards | PTX1 protein | 4631 | 0.097 | -0.1116 | No |
| 6 | KCNJ5 | KCNJ5 StanfordSource, GeneCards | potassium inwardly-rectifying channel, subfamily J, member 5 | 5008 | 0.086 | -0.1142 | No |
| 7 | GAS | GAS StanfordSource, GeneCards | gastrin | 5694 | 0.065 | -0.1429 | No |
| 8 | CAV3 | CAV3 StanfordSource, GeneCards | caveolin 3 | 6761 | 0.035 | -0.2048 | No |
| 9 | ASAH1 | ASAH1 StanfordSource, GeneCards | N-acylsphingosine amidohydrolase (acid ceramidase) 1 | 7530 | 0.013 | -0.2524 | No |
| 10 | RAC1 | RAC1 StanfordSource, GeneCards | ras-related C3 botulinum toxin substrate 1 (rho family, small GTP binding protein Rac1) | 7596 | 0.011 | -0.2539 | No |
| 11 | GNAQ | GNAQ StanfordSource, GeneCards | guanine nucleotide binding protein (G protein), q polypeptide | 8039 | -0.002 | -0.2829 | No |
| 12 | RYR1 | RYR1 StanfordSource, GeneCards | ryanodine receptor 1 (skeletal) | 8079 | -0.003 | -0.2848 | No |
| 13 | CAMP | CAMP StanfordSource, GeneCards | cathelicidin antimicrobial peptide | 9578 | -0.047 | -0.3723 | No |
| 14 | ITPR1 | ITPR1 StanfordSource, GeneCards | inositol 1,4,5-triphosphate receptor, type 1 | 9870 | -0.056 | -0.3771 | No |
| 15 | ITPR2 | ITPR2 StanfordSource, GeneCards | inositol 1,4,5-triphosphate receptor, type 2 | 10780 | -0.088 | -0.4148 | No |
| 16 | PITX2 | PITX2 StanfordSource, GeneCards | paired-like homeodomain transcription factor 2 | 11210 | -0.102 | -0.4168 | No |
| 17 | ITPR3 | ITPR3 StanfordSource, GeneCards | inositol 1,4,5-triphosphate receptor, type 3 | 11343 | -0.107 | -0.3977 | No |
| 18 | ADRB1 | ADRB1 StanfordSource, GeneCards | adrenergic, beta-1-, receptor | 11914 | -0.130 | -0.4020 | No |
| 19 | GNAI1 | GNAI1 StanfordSource, GeneCards | guanine nucleotide binding protein (G protein), alpha inhibiting activity polypeptide 1 | 12665 | -0.165 | -0.4092 | Yes |
| 20 | BF | BF StanfordSource, GeneCards | B-factor, properdin | 13046 | -0.187 | -0.3861 | Yes |
| 21 | MAPK1 | MAPK1 StanfordSource, GeneCards | mitogen-activated protein kinase 1 | 13258 | -0.200 | -0.3482 | Yes |
| 22 | HTATIP | HTATIP StanfordSource, GeneCards | HIV-1 Tat interactive protein, 60kDa | 13418 | -0.211 | -0.3041 | Yes |
| 23 | EPHB2 | EPHB2 StanfordSource, GeneCards | EphB2 | 13443 | -0.212 | -0.2506 | Yes |
| 24 | KCNJ9 | KCNJ9 StanfordSource, GeneCards | potassium inwardly-rectifying channel, subfamily J, member 9 | 13720 | -0.232 | -0.2088 | Yes |
| 25 | RHO | RHO StanfordSource, GeneCards | rhodopsin (opsin 2, rod pigment) (retinitis pigmentosa 4, autosomal dominant) | 14700 | -0.353 | -0.1823 | Yes |
| 26 | DAG1 | DAG1 StanfordSource, GeneCards | dystroglycan 1 (dystrophin-associated glycoprotein 1) | 14785 | -0.374 | -0.0908 | Yes |
| 27 | APC | APC StanfordSource, GeneCards | adenomatosis polyposis coli | 14925 | -0.419 | 0.0086 | Yes |