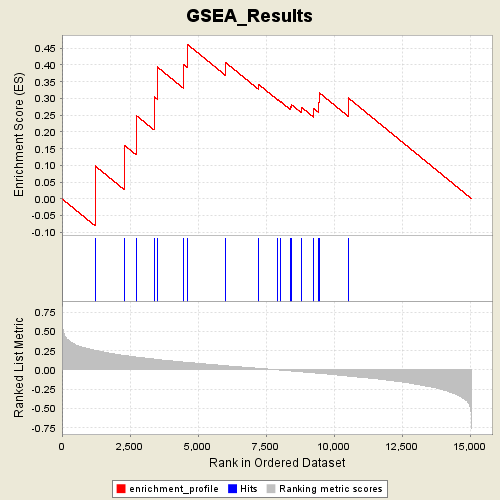
Profile of the Running ES Score & Positions of GeneSet Members on the Rank Ordered List
| Dataset | Diabetes_collapsed.gct |
| Phenotype | NGT |
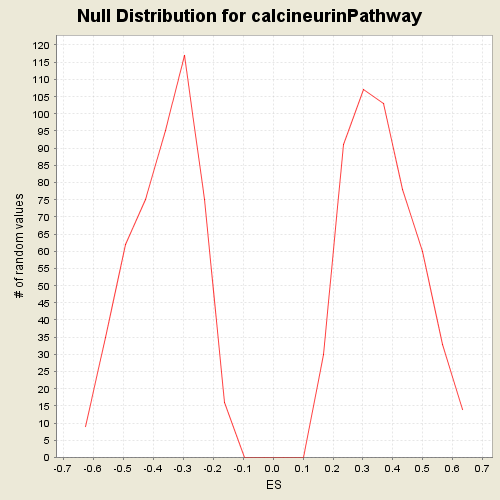
| GeneSet | C2.symbols.gmt#calcineurinPathway |
| Enrichment Score (ES) | 0.46132812 |
| Normalized Enrichment Score (NES) | 1.2689859 |
| Nominal p-value | 0.21705426 |
| FDR q-value | 1.0 |
| FWER p-Value | 1.0 |
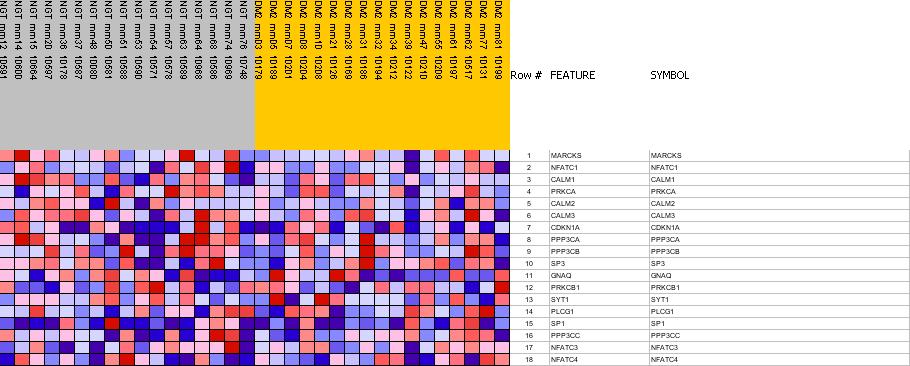
| PROBE | GENE SYMBOL | GENE_TITLE | RANK IN GENE LIST | RANK METRIC SCORE | RES | CORE_ENRICHMENT | |
|---|---|---|---|---|---|---|---|
| 1 | MARCKS | MARCKS StanfordSource, GeneCards | myristoylated alanine-rich protein kinase C substrate | 1221 | 0.254 | 0.0981 | Yes |
| 2 | NFATC1 | NFATC1 StanfordSource, GeneCards | nuclear factor of activated T-cells, cytoplasmic, calcineurin-dependent 1 | 2289 | 0.189 | 0.1602 | Yes |
| 3 | CALM1 | CALM1 StanfordSource, GeneCards | calmodulin 1 (phosphorylase kinase, delta) | 2731 | 0.167 | 0.2488 | Yes |
| 4 | PRKCA | PRKCA StanfordSource, GeneCards | protein kinase C, alpha | 3384 | 0.142 | 0.3051 | Yes |
| 5 | CALM2 | CALM2 StanfordSource, GeneCards | calmodulin 2 (phosphorylase kinase, delta) | 3499 | 0.137 | 0.3941 | Yes |
| 6 | CALM3 | CALM3 StanfordSource, GeneCards | calmodulin 3 (phosphorylase kinase, delta) | 4463 | 0.102 | 0.4022 | Yes |
| 7 | CDKN1A | CDKN1A StanfordSource, GeneCards | cyclin-dependent kinase inhibitor 1A (p21, Cip1) | 4612 | 0.098 | 0.4613 | Yes |
| 8 | PPP3CA | PPP3CA StanfordSource, GeneCards | protein phosphatase 3 (formerly 2B), catalytic subunit, alpha isoform (calcineurin A alpha) | 6009 | 0.055 | 0.4074 | No |
| 9 | PPP3CB | PPP3CB StanfordSource, GeneCards | protein phosphatase 3 (formerly 2B), catalytic subunit, beta isoform (calcineurin A beta) | 7216 | 0.021 | 0.3424 | No |
| 10 | SP3 | SP3 StanfordSource, GeneCards | Sp3 transcription factor | 7938 | 0.001 | 0.2955 | No |
| 11 | GNAQ | GNAQ StanfordSource, GeneCards | guanine nucleotide binding protein (G protein), q polypeptide | 8039 | -0.002 | 0.2899 | No |
| 12 | PRKCB1 | PRKCB1 StanfordSource, GeneCards | protein kinase C, beta 1 | 8387 | -0.012 | 0.2750 | No |
| 13 | SYT1 | SYT1 StanfordSource, GeneCards | synaptotagmin I | 8437 | -0.013 | 0.2809 | No |
| 14 | PLCG1 | PLCG1 StanfordSource, GeneCards | phospholipase C, gamma 1 (formerly subtype 148) | 8810 | -0.023 | 0.2727 | No |
| 15 | SP1 | SP1 StanfordSource, GeneCards | Sp1 transcription factor | 9249 | -0.037 | 0.2699 | No |
| 16 | PPP3CC | PPP3CC StanfordSource, GeneCards | protein phosphatase 3 (formerly 2B), catalytic subunit, gamma isoform (calcineurin A gamma) | 9445 | -0.043 | 0.2871 | No |
| 17 | NFATC3 | NFATC3 StanfordSource, GeneCards | nuclear factor of activated T-cells, cytoplasmic, calcineurin-dependent 3 | 9452 | -0.043 | 0.3170 | No |
| 18 | NFATC4 | NFATC4 StanfordSource, GeneCards | nuclear factor of activated T-cells, cytoplasmic, calcineurin-dependent 4 | 10515 | -0.079 | 0.3019 | No |