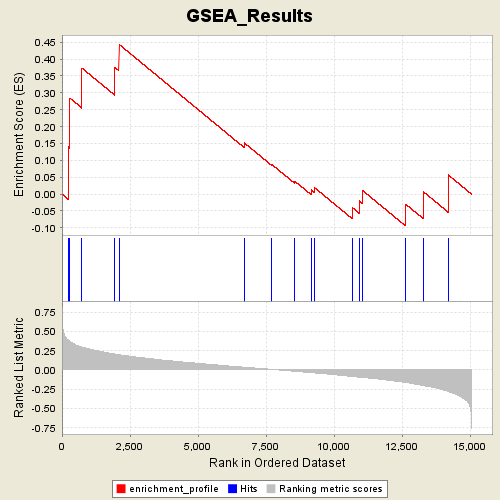
Profile of the Running ES Score & Positions of GeneSet Members on the Rank Ordered List
| Dataset | Diabetes_collapsed.gct |
| Phenotype | NGT |
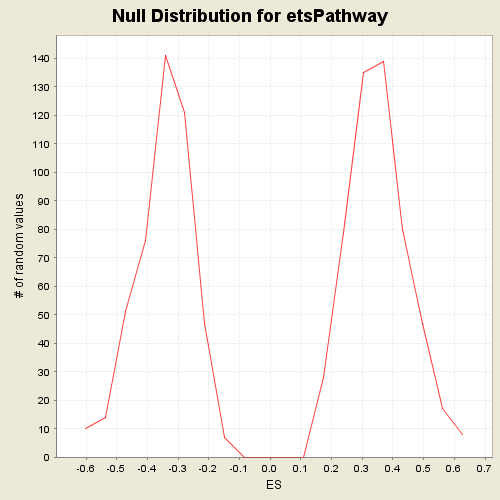
| GeneSet | C2.symbols.gmt#etsPathway |
| Enrichment Score (ES) | 0.44364506 |
| Normalized Enrichment Score (NES) | 1.2553954 |
| Nominal p-value | 0.17636022 |
| FDR q-value | 1.0 |
| FWER p-Value | 1.0 |
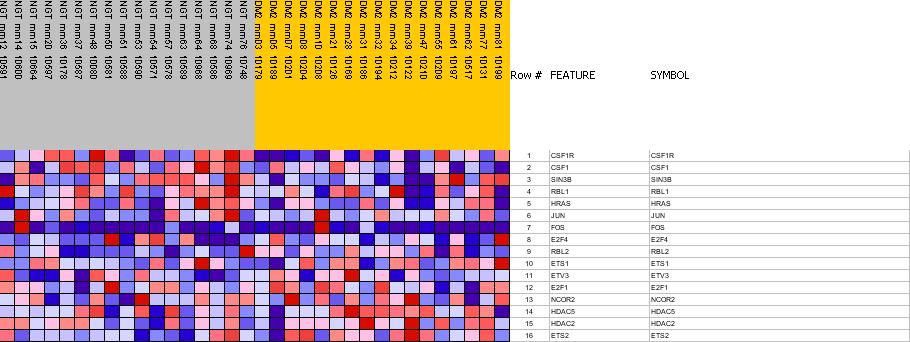
| PROBE | GENE SYMBOL | GENE_TITLE | RANK IN GENE LIST | RANK METRIC SCORE | RES | CORE_ENRICHMENT | |
|---|---|---|---|---|---|---|---|
| 1 | CSF1R | CSF1R StanfordSource, GeneCards | colony stimulating factor 1 receptor, formerly McDonough feline sarcoma viral (v-fms) oncogene homolog | 225 | 0.390 | 0.1401 | Yes |
| 2 | CSF1 | CSF1 StanfordSource, GeneCards | colony stimulating factor 1 (macrophage) | 287 | 0.373 | 0.2845 | Yes |
| 3 | SIN3B | SIN3B StanfordSource, GeneCards | SIN3 homolog B, transcriptional regulator (yeast) | 735 | 0.297 | 0.3730 | Yes |
| 4 | RBL1 | RBL1 StanfordSource, GeneCards | retinoblastoma-like 1 (p107) | 1935 | 0.207 | 0.3757 | Yes |
| 5 | HRAS | HRAS StanfordSource, GeneCards | v-Ha-ras Harvey rat sarcoma viral oncogene homolog | 2096 | 0.198 | 0.4436 | Yes |
| 6 | JUN | JUN StanfordSource, GeneCards | v-jun sarcoma virus 17 oncogene homolog (avian) | 6697 | 0.036 | 0.1522 | No |
| 7 | FOS | FOS StanfordSource, GeneCards | v-fos FBJ murine osteosarcoma viral oncogene homolog | 7712 | 0.008 | 0.0879 | No |
| 8 | E2F4 | E2F4 StanfordSource, GeneCards | E2F transcription factor 4, p107/p130-binding | 8553 | -0.016 | 0.0385 | No |
| 9 | RBL2 | RBL2 StanfordSource, GeneCards | retinoblastoma-like 2 (p130) | 9156 | -0.035 | 0.0123 | No |
| 10 | ETS1 | ETS1 StanfordSource, GeneCards | v-ets erythroblastosis virus E26 oncogene homolog 1 (avian) | 9290 | -0.039 | 0.0188 | No |
| 11 | ETV3 | ETV3 StanfordSource, GeneCards | ets variant gene 3 | 10668 | -0.083 | -0.0396 | No |
| 12 | E2F1 | E2F1 StanfordSource, GeneCards | E2F transcription factor 1 | 10933 | -0.093 | -0.0201 | No |
| 13 | NCOR2 | NCOR2 StanfordSource, GeneCards | nuclear receptor co-repressor 2 | 11048 | -0.097 | 0.0109 | No |
| 14 | HDAC5 | HDAC5 StanfordSource, GeneCards | histone deacetylase 5 | 12631 | -0.163 | -0.0295 | No |
| 15 | HDAC2 | HDAC2 StanfordSource, GeneCards | histone deacetylase 2 | 13280 | -0.201 | 0.0075 | No |
| 16 | ETS2 | ETS2 StanfordSource, GeneCards | v-ets erythroblastosis virus E26 oncogene homolog 2 (avian) | 14197 | -0.278 | 0.0570 | No |