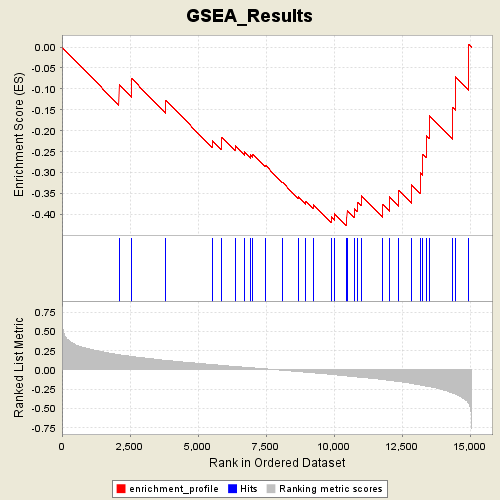
Profile of the Running ES Score & Positions of GeneSet Members on the Rank Ordered List
| Dataset | Diabetes_collapsed.gct |
| Phenotype | DMT |
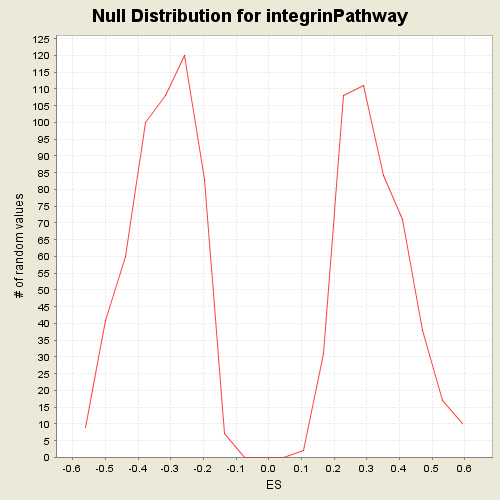
| GeneSet | C2.symbols.gmt#integrinPathway |
| Enrichment Score (ES) | -0.42804277 |
| Normalized Enrichment Score (NES) | -1.3104273 |
| Nominal p-value | 0.17045455 |
| FDR q-value | 1.0 |
| FWER p-Value | 0.999 |
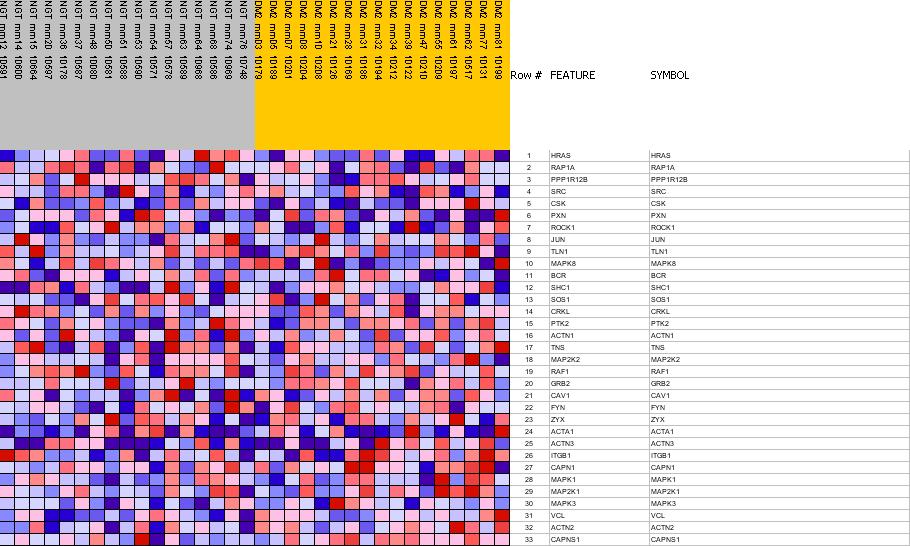
| PROBE | GENE SYMBOL | GENE_TITLE | RANK IN GENE LIST | RANK METRIC SCORE | RES | CORE_ENRICHMENT | |
|---|---|---|---|---|---|---|---|
| 1 | HRAS | HRAS StanfordSource, GeneCards | v-Ha-ras Harvey rat sarcoma viral oncogene homolog | 2096 | 0.198 | -0.0892 | No |
| 2 | RAP1A | RAP1A StanfordSource, GeneCards | RAP1A, member of RAS oncogene family | 2554 | 0.176 | -0.0748 | No |
| 3 | PPP1R12B | PPP1R12B StanfordSource, GeneCards | protein phosphatase 1, regulatory (inhibitor) subunit 12B | 3819 | 0.124 | -0.1274 | No |
| 4 | SRC | SRC StanfordSource, GeneCards | v-src sarcoma (Schmidt-Ruppin A-2) viral oncogene homolog (avian) | 5526 | 0.070 | -0.2231 | No |
| 5 | CSK | CSK StanfordSource, GeneCards | c-src tyrosine kinase | 5869 | 0.060 | -0.2305 | No |
| 6 | PXN | PXN StanfordSource, GeneCards | paxillin | 5875 | 0.060 | -0.2155 | No |
| 7 | ROCK1 | ROCK1 StanfordSource, GeneCards | Rho-associated, coiled-coil containing protein kinase 1 | 6367 | 0.045 | -0.2367 | No |
| 8 | JUN | JUN StanfordSource, GeneCards | v-jun sarcoma virus 17 oncogene homolog (avian) | 6697 | 0.036 | -0.2494 | No |
| 9 | TLN1 | TLN1 StanfordSource, GeneCards | talin 1 | 6940 | 0.029 | -0.2580 | No |
| 10 | MAPK8 | MAPK8 StanfordSource, GeneCards | mitogen-activated protein kinase 8 | 7018 | 0.027 | -0.2562 | No |
| 11 | BCR | BCR StanfordSource, GeneCards | breakpoint cluster region | 7469 | 0.015 | -0.2824 | No |
| 12 | SHC1 | SHC1 StanfordSource, GeneCards | SHC (Src homology 2 domain containing) transforming protein 1 | 8103 | -0.003 | -0.3237 | No |
| 13 | SOS1 | SOS1 StanfordSource, GeneCards | son of sevenless homolog 1 (Drosophila) | 8678 | -0.020 | -0.3569 | No |
| 14 | CRKL | CRKL StanfordSource, GeneCards | v-crk sarcoma virus CT10 oncogene homolog (avian)-like | 8965 | -0.029 | -0.3685 | No |
| 15 | PTK2 | PTK2 StanfordSource, GeneCards | PTK2 protein tyrosine kinase 2 | 9236 | -0.037 | -0.3771 | No |
| 16 | ACTN1 | ACTN1 StanfordSource, GeneCards | actinin, alpha 1 | 9893 | -0.057 | -0.4062 | No |
| 17 | TNS | TNS StanfordSource, GeneCards | tensin | 10012 | -0.061 | -0.3986 | No |
| 18 | MAP2K2 | MAP2K2 StanfordSource, GeneCards | mitogen-activated protein kinase kinase 2 | 10456 | -0.077 | -0.4085 | Yes |
| 19 | RAF1 | RAF1 StanfordSource, GeneCards | v-raf-1 murine leukemia viral oncogene homolog 1 | 10478 | -0.078 | -0.3902 | Yes |
| 20 | GRB2 | GRB2 StanfordSource, GeneCards | growth factor receptor-bound protein 2 | 10756 | -0.087 | -0.3865 | Yes |
| 21 | CAV1 | CAV1 StanfordSource, GeneCards | caveolin 1, caveolae protein, 22kDa | 10871 | -0.091 | -0.3709 | Yes |
| 22 | FYN | FYN StanfordSource, GeneCards | FYN oncogene related to SRC, FGR, YES | 10997 | -0.095 | -0.3550 | Yes |
| 23 | ZYX | ZYX StanfordSource, GeneCards | zyxin | 11787 | -0.125 | -0.3758 | Yes |
| 24 | ACTA1 | ACTA1 StanfordSource, GeneCards | actin, alpha 1, skeletal muscle | 12042 | -0.134 | -0.3585 | Yes |
| 25 | ACTN3 | ACTN3 StanfordSource, GeneCards | actinin, alpha 3 | 12385 | -0.151 | -0.3429 | Yes |
| 26 | ITGB1 | ITGB1 StanfordSource, GeneCards | integrin, beta 1 (fibronectin receptor, beta polypeptide, antigen CD29 includes MDF2, MSK12) | 12853 | -0.175 | -0.3295 | Yes |
| 27 | CAPN1 | CAPN1 StanfordSource, GeneCards | calpain 1, (mu/I) large subunit | 13166 | -0.194 | -0.3008 | Yes |
| 28 | MAPK1 | MAPK1 StanfordSource, GeneCards | mitogen-activated protein kinase 1 | 13258 | -0.200 | -0.2560 | Yes |
| 29 | MAP2K1 | MAP2K1 StanfordSource, GeneCards | mitogen-activated protein kinase kinase 1 | 13396 | -0.210 | -0.2118 | Yes |
| 30 | MAPK3 | MAPK3 StanfordSource, GeneCards | mitogen-activated protein kinase 3 | 13499 | -0.216 | -0.1636 | Yes |
| 31 | VCL | VCL StanfordSource, GeneCards | vinculin | 14373 | -0.300 | -0.1453 | Yes |
| 32 | ACTN2 | ACTN2 StanfordSource, GeneCards | actinin, alpha 2 | 14458 | -0.312 | -0.0715 | Yes |
| 33 | CAPNS1 | CAPNS1 StanfordSource, GeneCards | calpain, small subunit 1 | 14955 | -0.437 | 0.0067 | Yes |