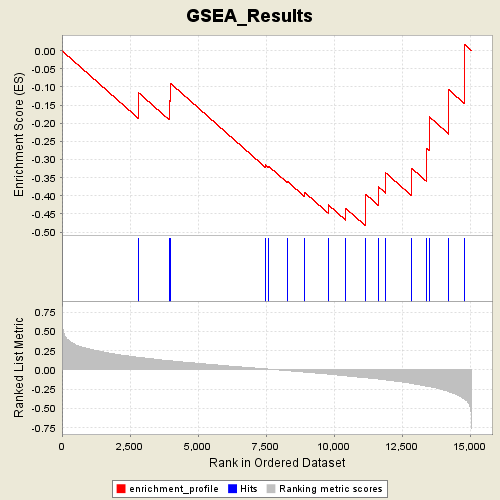
Profile of the Running ES Score & Positions of GeneSet Members on the Rank Ordered List
| Dataset | Diabetes_collapsed.gct |
| Phenotype | DMT |
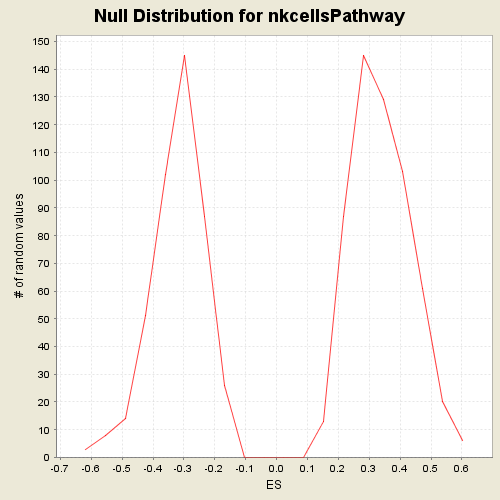
| GeneSet | C2.symbols.gmt#nkcellsPathway |
| Enrichment Score (ES) | -0.4832462 |
| Normalized Enrichment Score (NES) | -1.509105 |
| Nominal p-value | 0.038990825 |
| FDR q-value | 1.0 |
| FWER p-Value | 0.942 |
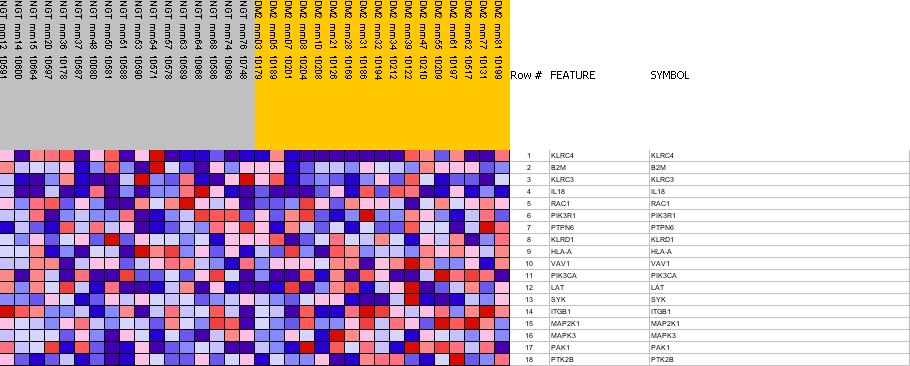
| PROBE | GENE SYMBOL | GENE_TITLE | RANK IN GENE LIST | RANK METRIC SCORE | RES | CORE_ENRICHMENT | |
|---|---|---|---|---|---|---|---|
| 1 | KLRC4 | KLRC4 StanfordSource, GeneCards | killer cell lectin-like receptor subfamily C, member 4 | 2816 | 0.164 | -0.1159 | No |
| 2 | B2M | B2M StanfordSource, GeneCards | beta-2-microglobulin | 3937 | 0.120 | -0.1381 | No |
| 3 | KLRC3 | KLRC3 StanfordSource, GeneCards | killer cell lectin-like receptor subfamily C, member 3 | 3988 | 0.119 | -0.0898 | No |
| 4 | IL18 | IL18 StanfordSource, GeneCards | interleukin 18 (interferon-gamma-inducing factor) | 7473 | 0.015 | -0.3151 | No |
| 5 | RAC1 | RAC1 StanfordSource, GeneCards | ras-related C3 botulinum toxin substrate 1 (rho family, small GTP binding protein Rac1) | 7596 | 0.011 | -0.3184 | No |
| 6 | PIK3R1 | PIK3R1 StanfordSource, GeneCards | phosphoinositide-3-kinase, regulatory subunit, polypeptide 1 (p85 alpha) | 8274 | -0.009 | -0.3597 | No |
| 7 | PTPN6 | PTPN6 StanfordSource, GeneCards | protein tyrosine phosphatase, non-receptor type 6 | 8933 | -0.028 | -0.3913 | No |
| 8 | KLRD1 | KLRD1 StanfordSource, GeneCards | killer cell lectin-like receptor subfamily D, member 1 | 9786 | -0.054 | -0.4247 | No |
| 9 | HLA-A | HLA-A StanfordSource, GeneCards | major histocompatibility complex, class I, A | 10426 | -0.076 | -0.4344 | No |
| 10 | VAV1 | VAV1 StanfordSource, GeneCards | vav 1 oncogene | 11162 | -0.101 | -0.4394 | Yes |
| 11 | PIK3CA | PIK3CA StanfordSource, GeneCards | phosphoinositide-3-kinase, catalytic, alpha polypeptide | 11164 | -0.101 | -0.3955 | Yes |
| 12 | LAT | LAT StanfordSource, GeneCards | linker for activation of T cells | 11644 | -0.119 | -0.3759 | Yes |
| 13 | SYK | SYK StanfordSource, GeneCards | spleen tyrosine kinase | 11907 | -0.129 | -0.3371 | Yes |
| 14 | ITGB1 | ITGB1 StanfordSource, GeneCards | integrin, beta 1 (fibronectin receptor, beta polypeptide, antigen CD29 includes MDF2, MSK12) | 12853 | -0.175 | -0.3239 | Yes |
| 15 | MAP2K1 | MAP2K1 StanfordSource, GeneCards | mitogen-activated protein kinase kinase 1 | 13396 | -0.210 | -0.2689 | Yes |
| 16 | MAPK3 | MAPK3 StanfordSource, GeneCards | mitogen-activated protein kinase 3 | 13499 | -0.216 | -0.1819 | Yes |
| 17 | PAK1 | PAK1 StanfordSource, GeneCards | p21/Cdc42/Rac1-activated kinase 1 (STE20 homolog, yeast) | 14220 | -0.281 | -0.1077 | Yes |
| 18 | PTK2B | PTK2B StanfordSource, GeneCards | PTK2B protein tyrosine kinase 2 beta | 14790 | -0.376 | 0.0176 | Yes |