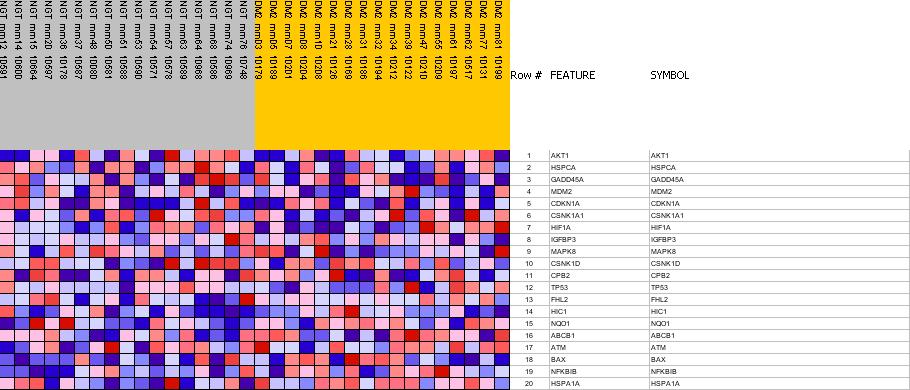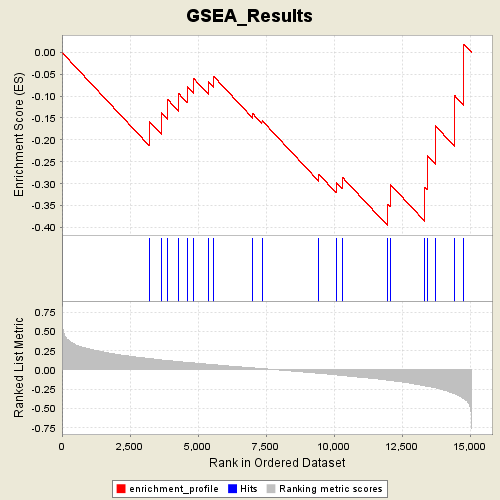
Profile of the Running ES Score & Positions of GeneSet Members on the Rank Ordered List
| Dataset | Diabetes_collapsed.gct |
| Phenotype | DMT |
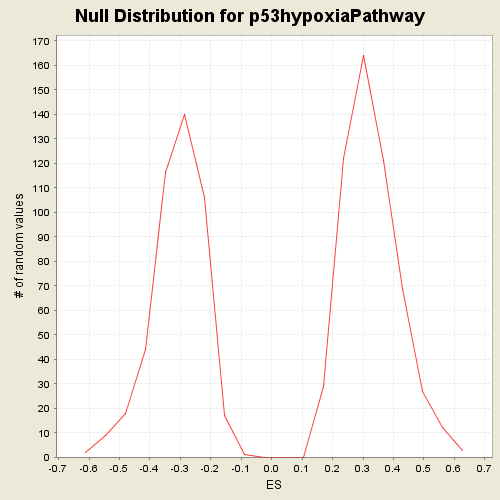
| GeneSet | C2.symbols.gmt#p53hypoxiaPathway |
| Enrichment Score (ES) | -0.39685705 |
| Normalized Enrichment Score (NES) | -1.2790046 |
| Nominal p-value | 0.12803532 |
| FDR q-value | 1.0 |
| FWER p-Value | 1.0 |
| PROBE | GENE SYMBOL | GENE_TITLE | RANK IN GENE LIST | RANK METRIC SCORE | RES | CORE_ENRICHMENT | |
|---|---|---|---|---|---|---|---|
| 1 | AKT1 | AKT1 StanfordSource, GeneCards | v-akt murine thymoma viral oncogene homolog 1 | 3210 | 0.148 | -0.1579 | No |
| 2 | HSPCA | HSPCA StanfordSource, GeneCards | heat shock 90kDa protein 1, alpha | 3646 | 0.131 | -0.1377 | No |
| 3 | GADD45A | GADD45A StanfordSource, GeneCards | growth arrest and DNA-damage-inducible, alpha | 3872 | 0.122 | -0.1068 | No |
| 4 | MDM2 | MDM2 StanfordSource, GeneCards | Mdm2, transformed 3T3 cell double minute 2, p53 binding protein (mouse) | 4299 | 0.107 | -0.0948 | No |
| 5 | CDKN1A | CDKN1A StanfordSource, GeneCards | cyclin-dependent kinase inhibitor 1A (p21, Cip1) | 4612 | 0.098 | -0.0788 | No |
| 6 | CSNK1A1 | CSNK1A1 StanfordSource, GeneCards | casein kinase 1, alpha 1 | 4832 | 0.091 | -0.0592 | No |
| 7 | HIF1A | HIF1A StanfordSource, GeneCards | hypoxia-inducible factor 1, alpha subunit (basic helix-loop-helix transcription factor) | 5378 | 0.075 | -0.0674 | No |
| 8 | IGFBP3 | IGFBP3 StanfordSource, GeneCards | insulin-like growth factor binding protein 3 | 5585 | 0.068 | -0.0554 | No |
| 9 | MAPK8 | MAPK8 StanfordSource, GeneCards | mitogen-activated protein kinase 8 | 7018 | 0.027 | -0.1403 | No |
| 10 | CSNK1D | CSNK1D StanfordSource, GeneCards | casein kinase 1, delta | 7353 | 0.018 | -0.1559 | No |
| 11 | CPB2 | CPB2 StanfordSource, GeneCards | carboxypeptidase B2 (plasma, carboxypeptidase U) | 9447 | -0.043 | -0.2789 | No |
| 12 | TP53 | TP53 StanfordSource, GeneCards | tumor protein p53 (Li-Fraumeni syndrome) | 10076 | -0.063 | -0.2969 | No |
| 13 | FHL2 | FHL2 StanfordSource, GeneCards | four and a half LIM domains 2 | 10299 | -0.071 | -0.2850 | No |
| 14 | HIC1 | HIC1 StanfordSource, GeneCards | hypermethylated in cancer 1 | 11982 | -0.132 | -0.3471 | Yes |
| 15 | NQO1 | NQO1 StanfordSource, GeneCards | NAD(P)H dehydrogenase, quinone 1 | 12068 | -0.136 | -0.3018 | Yes |
| 16 | ABCB1 | ABCB1 StanfordSource, GeneCards | ATP-binding cassette, sub-family B (MDR/TAP), member 1 | 13338 | -0.205 | -0.3089 | Yes |
| 17 | ATM | ATM StanfordSource, GeneCards | ataxia telangiectasia mutated (includes complementation groups A, C and D) | 13422 | -0.211 | -0.2351 | Yes |
| 18 | BAX | BAX StanfordSource, GeneCards | BCL2-associated X protein | 13725 | -0.233 | -0.1678 | Yes |
| 19 | NFKBIB | NFKBIB StanfordSource, GeneCards | nuclear factor of kappa light polypeptide gene enhancer in B-cells inhibitor, beta | 14439 | -0.309 | -0.0991 | Yes |
| 20 | HSPA1A | HSPA1A StanfordSource, GeneCards | heat shock 70kDa protein 1A | 14776 | -0.372 | 0.0186 | Yes |