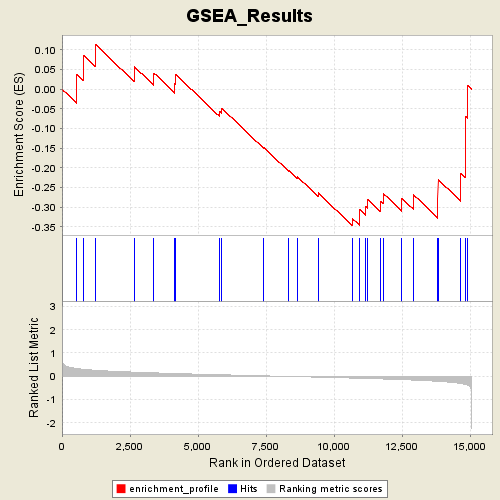
Profile of the Running ES Score & Positions of GeneSet Members on the Rank Ordered List
| Dataset | Gender_collapsed.gct |
| Phenotype | FEMALE |
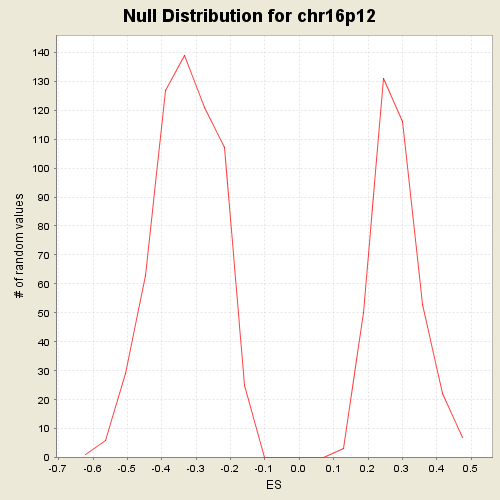
| GeneSet | C1.symbols.gmt#chr16p12 |
| Enrichment Score (ES) | -0.34797782 |
| Normalized Enrichment Score (NES) | -1.0570252 |
| Nominal p-value | 0.40614888 |
| FDR q-value | 1.0 |
| FWER p-Value | 0.942 |
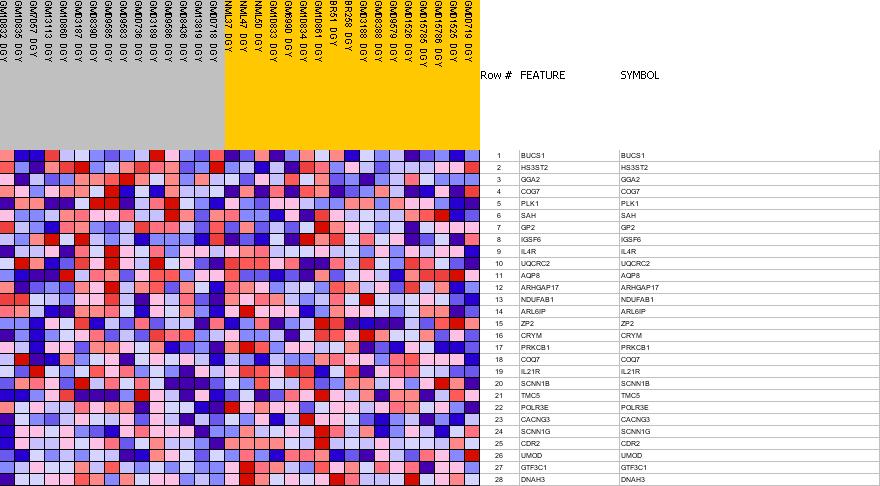
| PROBE | GENE SYMBOL | GENE_TITLE | RANK IN GENE LIST | RANK METRIC SCORE | RES | CORE_ENRICHMENT | |
|---|---|---|---|---|---|---|---|
| 1 | BUCS1 | BUCS1 StanfordSource, GeneCards | butyryl Coenzyme A synthetase 1 | 549 | 0.328 | 0.0365 | No |
| 2 | HS3ST2 | HS3ST2 StanfordSource, GeneCards | heparan sulfate (glucosamine) 3-O-sulfotransferase 2 | 788 | 0.296 | 0.0866 | No |
| 3 | GGA2 | GGA2 StanfordSource, GeneCards | golgi associated, gamma adaptin ear containing, ARF binding protein 2 | 1224 | 0.253 | 0.1139 | No |
| 4 | COG7 | COG7 StanfordSource, GeneCards | component of oligomeric golgi complex 7 | 2650 | 0.174 | 0.0578 | No |
| 5 | PLK1 | PLK1 StanfordSource, GeneCards | polo-like kinase 1 (Drosophila) | 3382 | 0.142 | 0.0408 | No |
| 6 | SAH | SAH StanfordSource, GeneCards | SA hypertension-associated homolog (rat) | 4154 | 0.112 | 0.0145 | No |
| 7 | GP2 | GP2 StanfordSource, GeneCards | glycoprotein 2 (zymogen granule membrane) | 4182 | 0.111 | 0.0375 | No |
| 8 | IGSF6 | IGSF6 StanfordSource, GeneCards | immunoglobulin superfamily, member 6 | 5807 | 0.060 | -0.0571 | No |
| 9 | IL4R | IL4R StanfordSource, GeneCards | interleukin 4 receptor | 5871 | 0.059 | -0.0482 | No |
| 10 | UQCRC2 | UQCRC2 StanfordSource, GeneCards | ubiquinol-cytochrome c reductase core protein II | 7416 | 0.013 | -0.1481 | No |
| 11 | AQP8 | AQP8 StanfordSource, GeneCards | aquaporin 8 | 8339 | -0.013 | -0.2065 | No |
| 12 | ARHGAP17 | ARHGAP17 StanfordSource, GeneCards | Rho GTPase activating protein 17 | 8643 | -0.021 | -0.2220 | No |
| 13 | NDUFAB1 | NDUFAB1 StanfordSource, GeneCards | NADH dehydrogenase (ubiquinone) 1, alpha/beta subcomplex, 1, 8kDa | 9419 | -0.043 | -0.2639 | No |
| 14 | ARL6IP | ARL6IP StanfordSource, GeneCards | ADP-ribosylation factor-like 6 interacting protein | 10683 | -0.083 | -0.3295 | Yes |
| 15 | ZP2 | ZP2 StanfordSource, GeneCards | zona pellucida glycoprotein 2 (sperm receptor) | 10936 | -0.091 | -0.3260 | Yes |
| 16 | CRYM | CRYM StanfordSource, GeneCards | crystallin, mu | 10954 | -0.092 | -0.3067 | Yes |
| 17 | PRKCB1 | PRKCB1 StanfordSource, GeneCards | protein kinase C, beta 1 | 11169 | -0.100 | -0.2987 | Yes |
| 18 | COQ7 | COQ7 StanfordSource, GeneCards | coenzyme Q7 homolog, ubiquinone (yeast) | 11231 | -0.102 | -0.2801 | Yes |
| 19 | IL21R | IL21R StanfordSource, GeneCards | interleukin 21 receptor | 11711 | -0.118 | -0.2857 | Yes |
| 20 | SCNN1B | SCNN1B StanfordSource, GeneCards | sodium channel, nonvoltage-gated 1, beta (Liddle syndrome) | 11805 | -0.122 | -0.2648 | Yes |
| 21 | TMC5 | TMC5 StanfordSource, GeneCards | transmembrane channel-like 5 | 12489 | -0.149 | -0.2771 | Yes |
| 22 | POLR3E | POLR3E StanfordSource, GeneCards | polymerase (RNA) III (DNA directed) polypeptide E (80kD) | 12911 | -0.168 | -0.2676 | Yes |
| 23 | CACNG3 | CACNG3 StanfordSource, GeneCards | calcium channel, voltage-dependent, gamma subunit 3 | 13822 | -0.221 | -0.2789 | Yes |
| 24 | SCNN1G | SCNN1G StanfordSource, GeneCards | sodium channel, nonvoltage-gated 1, gamma | 13823 | -0.222 | -0.2295 | Yes |
| 25 | CDR2 | CDR2 StanfordSource, GeneCards | cerebellar degeneration-related protein 2, 62kDa | 14665 | -0.317 | -0.2149 | Yes |
| 26 | UMOD | UMOD StanfordSource, GeneCards | uromodulin (uromucoid, Tamm-Horsfall glycoprotein) | 14833 | -0.351 | -0.1478 | Yes |
| 27 | GTF3C1 | GTF3C1 StanfordSource, GeneCards | general transcription factor IIIC, polypeptide 1, alpha 220kDa | 14839 | -0.353 | -0.0695 | Yes |
| 28 | DNAH3 | DNAH3 StanfordSource, GeneCards | dynein, axonemal, heavy polypeptide 3 | 14911 | -0.377 | 0.0096 | Yes |