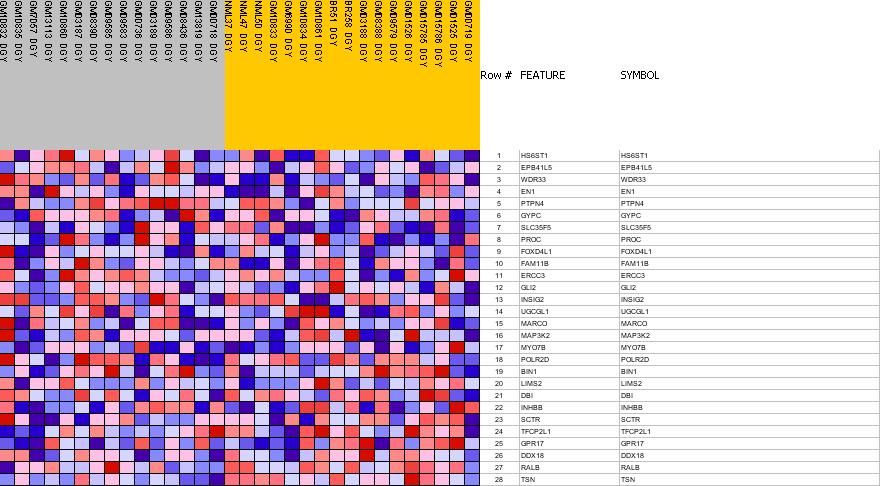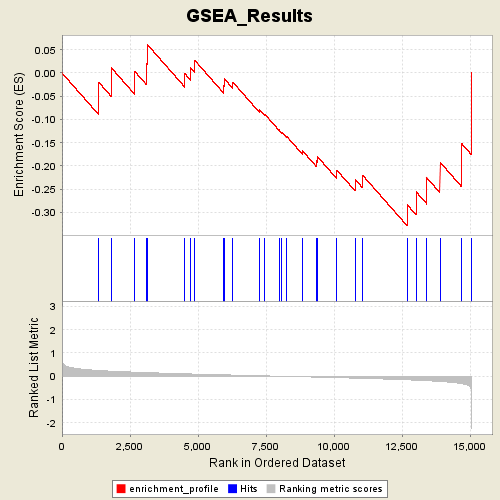
Profile of the Running ES Score & Positions of GeneSet Members on the Rank Ordered List
| Dataset | Gender_collapsed.gct |
| Phenotype | FEMALE |
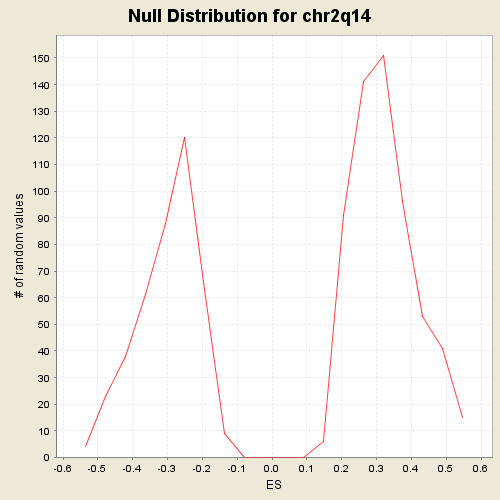
| GeneSet | C1.symbols.gmt#chr2q14 |
| Enrichment Score (ES) | -0.32939243 |
| Normalized Enrichment Score (NES) | -1.0975692 |
| Nominal p-value | 0.33743843 |
| FDR q-value | 1.0 |
| FWER p-Value | 0.935 |
| PROBE | GENE SYMBOL | GENE_TITLE | RANK IN GENE LIST | RANK METRIC SCORE | RES | CORE_ENRICHMENT | |
|---|---|---|---|---|---|---|---|
| 1 | HS6ST1 | HS6ST1 StanfordSource, GeneCards | heparan sulfate 6-O-sulfotransferase 1 | 1356 | 0.243 | -0.0204 | No |
| 2 | EPB41L5 | EPB41L5 StanfordSource, GeneCards | erythrocyte membrane protein band 4.1 like 5 | 1803 | 0.215 | 0.0118 | No |
| 3 | WDR33 | WDR33 StanfordSource, GeneCards | WD repeat domain 33 | 2677 | 0.172 | 0.0033 | No |
| 4 | EN1 | EN1 StanfordSource, GeneCards | engrailed homolog 1 | 3094 | 0.154 | 0.0200 | No |
| 5 | PTPN4 | PTPN4 StanfordSource, GeneCards | protein tyrosine phosphatase, non-receptor type 4 (megakaryocyte) | 3129 | 0.153 | 0.0617 | No |
| 6 | GYPC | GYPC StanfordSource, GeneCards | glycophorin C (Gerbich blood group) | 4518 | 0.101 | -0.0017 | No |
| 7 | SLC35F5 | SLC35F5 StanfordSource, GeneCards | solute carrier family 35, member F5 | 4730 | 0.094 | 0.0113 | No |
| 8 | PROC | PROC StanfordSource, GeneCards | protein C (inactivator of coagulation factors Va and VIIIa) | 4877 | 0.090 | 0.0274 | No |
| 9 | FOXD4L1 | FOXD4L1 StanfordSource, GeneCards | forkhead box D4 like 1 | 5940 | 0.057 | -0.0270 | No |
| 10 | FAM11B | FAM11B StanfordSource, GeneCards | family with sequence similarity 11 member B | 5964 | 0.056 | -0.0123 | No |
| 11 | ERCC3 | ERCC3 StanfordSource, GeneCards | excision repair cross-complementing rodent repair deficiency, complementation group 3 (xeroderma pigmentosum group B complementing) | 6286 | 0.047 | -0.0201 | No |
| 12 | GLI2 | GLI2 StanfordSource, GeneCards | GLI-Kruppel family member GLI2 | 7251 | 0.019 | -0.0789 | No |
| 13 | INSIG2 | INSIG2 StanfordSource, GeneCards | insulin induced gene 2 | 7453 | 0.012 | -0.0888 | No |
| 14 | UGCGL1 | UGCGL1 StanfordSource, GeneCards | UDP-glucose ceramide glucosyltransferase-like 1 | 7981 | -0.003 | -0.1228 | No |
| 15 | MARCO | MARCO StanfordSource, GeneCards | macrophage receptor with collagenous structure | 8081 | -0.006 | -0.1277 | No |
| 16 | MAP3K2 | MAP3K2 StanfordSource, GeneCards | mitogen-activated protein kinase kinase kinase 2 | 8252 | -0.010 | -0.1360 | No |
| 17 | MYO7B | MYO7B StanfordSource, GeneCards | myosin VIIB | 8847 | -0.026 | -0.1680 | No |
| 18 | POLR2D | POLR2D StanfordSource, GeneCards | polymerase (RNA) II (DNA directed) polypeptide D | 9342 | -0.040 | -0.1892 | No |
| 19 | BIN1 | BIN1 StanfordSource, GeneCards | bridging integrator 1 | 9393 | -0.042 | -0.1804 | No |
| 20 | LIMS2 | LIMS2 StanfordSource, GeneCards | LIM and senescent cell antigen-like domains 2 | 10102 | -0.064 | -0.2092 | No |
| 21 | DBI | DBI StanfordSource, GeneCards | diazepam binding inhibitor (GABA receptor modulator, acyl-Coenzyme A binding protein) | 10774 | -0.086 | -0.2291 | No |
| 22 | INHBB | INHBB StanfordSource, GeneCards | inhibin, beta B (activin AB beta polypeptide) | 11052 | -0.095 | -0.2202 | No |
| 23 | SCTR | SCTR StanfordSource, GeneCards | secretin receptor | 12694 | -0.158 | -0.2840 | Yes |
| 24 | TFCP2L1 | TFCP2L1 StanfordSource, GeneCards | transcription factor CP2-like 1 | 13016 | -0.173 | -0.2556 | Yes |
| 25 | GPR17 | GPR17 StanfordSource, GeneCards | G protein-coupled receptor 17 | 13416 | -0.195 | -0.2260 | Yes |
| 26 | DDX18 | DDX18 StanfordSource, GeneCards | DEAD (Asp-Glu-Ala-Asp) box polypeptide 18 | 13897 | -0.229 | -0.1921 | Yes |
| 27 | RALB | RALB StanfordSource, GeneCards | v-ral simian leukemia viral oncogene homolog B (ras related; GTP binding protein) | 14697 | -0.323 | -0.1524 | Yes |
| 28 | TSN | TSN StanfordSource, GeneCards | translin | 15045 | -0.612 | 0.0007 | Yes |