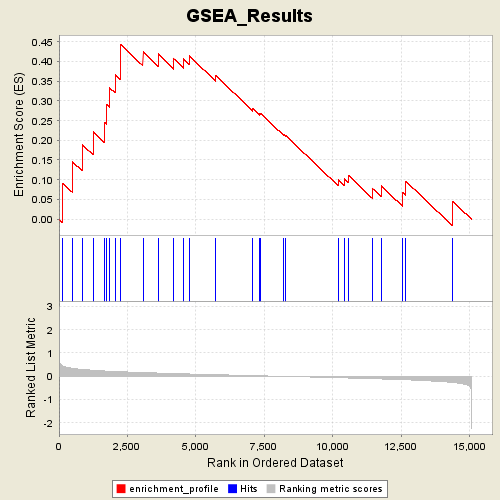
Profile of the Running ES Score & Positions of GeneSet Members on the Rank Ordered List
| Dataset | Gender_collapsed.gct |
| Phenotype | MALE |
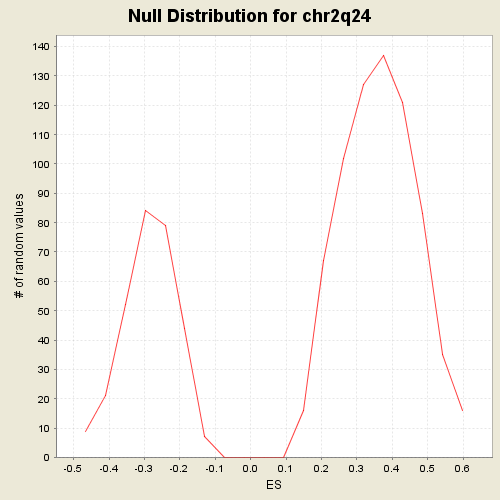
| GeneSet | C1.symbols.gmt#chr2q24 |
| Enrichment Score (ES) | 0.44333562 |
| Normalized Enrichment Score (NES) | 1.2203722 |
| Nominal p-value | 0.24857955 |
| FDR q-value | 1.0 |
| FWER p-Value | 0.938 |
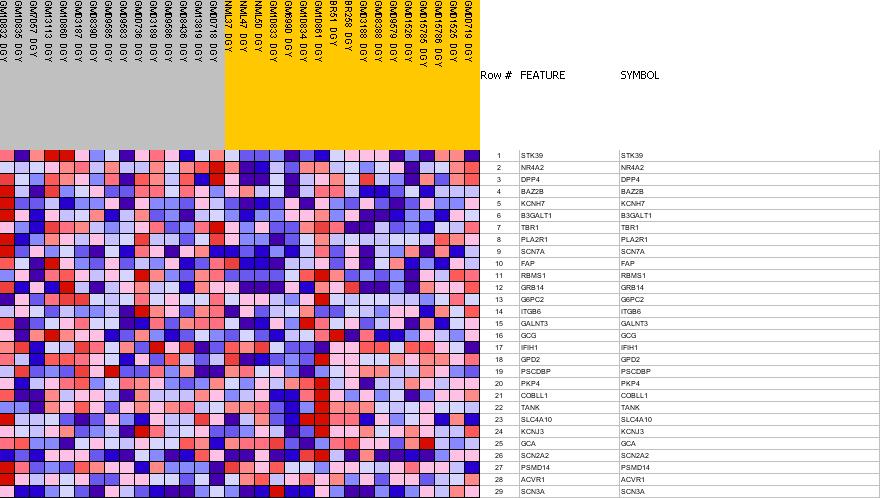
| PROBE | GENE SYMBOL | GENE_TITLE | RANK IN GENE LIST | RANK METRIC SCORE | RES | CORE_ENRICHMENT | |
|---|---|---|---|---|---|---|---|
| 1 | STK39 | STK39 StanfordSource, GeneCards | serine threonine kinase 39 (STE20/SPS1 homolog, yeast) | 145 | 0.433 | 0.0908 | Yes |
| 2 | NR4A2 | NR4A2 StanfordSource, GeneCards | nuclear receptor subfamily 4, group A, member 2 | 500 | 0.335 | 0.1451 | Yes |
| 3 | DPP4 | DPP4 StanfordSource, GeneCards | dipeptidylpeptidase 4 (CD26, adenosine deaminase complexing protein 2) | 843 | 0.290 | 0.1895 | Yes |
| 4 | BAZ2B | BAZ2B StanfordSource, GeneCards | bromodomain adjacent to zinc finger domain, 2B | 1244 | 0.251 | 0.2212 | Yes |
| 5 | KCNH7 | KCNH7 StanfordSource, GeneCards | potassium voltage-gated channel, subfamily H (eag-related), member 7 | 1658 | 0.223 | 0.2454 | Yes |
| 6 | B3GALT1 | B3GALT1 StanfordSource, GeneCards | UDP-Gal:betaGlcNAc beta 1,3-galactosyltransferase, polypeptide 1 | 1731 | 0.219 | 0.2914 | Yes |
| 7 | TBR1 | TBR1 StanfordSource, GeneCards | T-box, brain, 1 | 1842 | 0.213 | 0.3335 | Yes |
| 8 | PLA2R1 | PLA2R1 StanfordSource, GeneCards | phospholipase A2 receptor 1, 180kDa | 2047 | 0.201 | 0.3667 | Yes |
| 9 | SCN7A | SCN7A StanfordSource, GeneCards | sodium channel, voltage-gated, type VII, alpha | 2230 | 0.193 | 0.3994 | Yes |
| 10 | FAP | FAP StanfordSource, GeneCards | fibroblast activation protein, alpha | 2242 | 0.193 | 0.4433 | Yes |
| 11 | RBMS1 | RBMS1 StanfordSource, GeneCards | RNA binding motif, single stranded interacting protein 1 | 3067 | 0.156 | 0.4246 | No |
| 12 | GRB14 | GRB14 StanfordSource, GeneCards | growth factor receptor-bound protein 14 | 3620 | 0.133 | 0.4187 | No |
| 13 | G6PC2 | G6PC2 StanfordSource, GeneCards | glucose-6-phosphatase, catalytic, 2 | 4196 | 0.111 | 0.4062 | No |
| 14 | ITGB6 | ITGB6 StanfordSource, GeneCards | integrin, beta 6 | 4543 | 0.100 | 0.4064 | No |
| 15 | GALNT3 | GALNT3 StanfordSource, GeneCards | UDP-N-acetyl-alpha-D-galactosamine:polypeptide N-acetylgalactosaminyltransferase 3 (GalNAc-T3) | 4751 | 0.093 | 0.4142 | No |
| 16 | GCG | GCG StanfordSource, GeneCards | glucagon | 5718 | 0.063 | 0.3645 | No |
| 17 | IFIH1 | IFIH1 StanfordSource, GeneCards | interferon induced with helicase C domain 1 | 7079 | 0.024 | 0.2796 | No |
| 18 | GPD2 | GPD2 StanfordSource, GeneCards | glycerol-3-phosphate dehydrogenase 2 (mitochondrial) | 7317 | 0.016 | 0.2676 | No |
| 19 | PSCDBP | PSCDBP StanfordSource, GeneCards | pleckstrin homology, Sec7 and coiled-coil domains, binding protein | 7367 | 0.015 | 0.2677 | No |
| 20 | PKP4 | PKP4 StanfordSource, GeneCards | plakophilin 4 | 8204 | -0.009 | 0.2143 | No |
| 21 | COBLL1 | COBLL1 StanfordSource, GeneCards | COBL-like 1 | 8264 | -0.011 | 0.2128 | No |
| 22 | TANK | TANK StanfordSource, GeneCards | TRAF family member-associated NFKB activator | 10193 | -0.067 | 0.1000 | No |
| 23 | SLC4A10 | SLC4A10 StanfordSource, GeneCards | solute carrier family 4, sodium bicarbonate transporter-like, member 10 | 10426 | -0.074 | 0.1018 | No |
| 24 | KCNJ3 | KCNJ3 StanfordSource, GeneCards | potassium inwardly-rectifying channel, subfamily J, member 3 | 10568 | -0.079 | 0.1107 | No |
| 25 | GCA | GCA StanfordSource, GeneCards | grancalcin, EF-hand calcium binding protein | 11431 | -0.109 | 0.0786 | No |
| 26 | SCN2A2 | SCN2A2 StanfordSource, GeneCards | sodium channel, voltage-gated, type II, alpha 2 | 11767 | -0.120 | 0.0841 | No |
| 27 | PSMD14 | PSMD14 StanfordSource, GeneCards | proteasome (prosome, macropain) 26S subunit, non-ATPase, 14 | 12552 | -0.152 | 0.0672 | No |
| 28 | ACVR1 | ACVR1 StanfordSource, GeneCards | activin A receptor, type I | 12658 | -0.156 | 0.0965 | No |
| 29 | SCN3A | SCN3A StanfordSource, GeneCards | sodium channel, voltage-gated, type III, alpha | 14369 | -0.271 | 0.0457 | No |