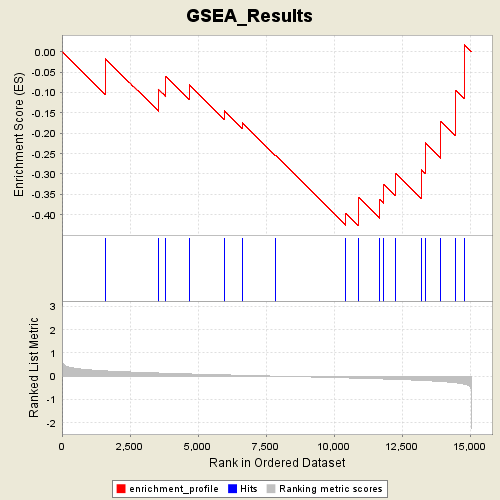
Profile of the Running ES Score & Positions of GeneSet Members on the Rank Ordered List
| Dataset | Gender_collapsed.gct |
| Phenotype | FEMALE |
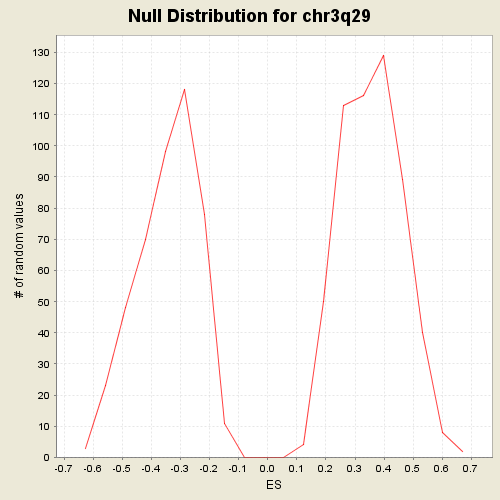
| GeneSet | C1.symbols.gmt#chr3q29 |
| Enrichment Score (ES) | -0.42757136 |
| Normalized Enrichment Score (NES) | -1.2403221 |
| Nominal p-value | 0.23608018 |
| FDR q-value | 1.0 |
| FWER p-Value | 0.876 |
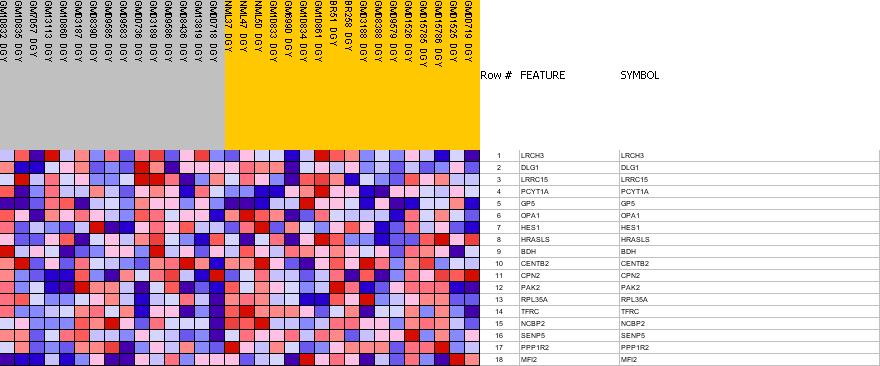
| PROBE | GENE SYMBOL | GENE_TITLE | RANK IN GENE LIST | RANK METRIC SCORE | RES | CORE_ENRICHMENT | |
|---|---|---|---|---|---|---|---|
| 1 | LRCH3 | LRCH3 StanfordSource, GeneCards | leucine-rich repeats and calponin homology (CH) domain containing 3 | 1596 | 0.227 | -0.0167 | No |
| 2 | DLG1 | DLG1 StanfordSource, GeneCards | discs, large homolog 1 (Drosophila) | 3537 | 0.136 | -0.0921 | No |
| 3 | LRRC15 | LRRC15 StanfordSource, GeneCards | leucine rich repeat containing 15 | 3821 | 0.125 | -0.0617 | No |
| 4 | PCYT1A | PCYT1A StanfordSource, GeneCards | phosphate cytidylyltransferase 1, choline, alpha isoform | 4674 | 0.096 | -0.0806 | No |
| 5 | GP5 | GP5 StanfordSource, GeneCards | glycoprotein V (platelet) | 5960 | 0.056 | -0.1438 | No |
| 6 | OPA1 | OPA1 StanfordSource, GeneCards | optic atrophy 1 (autosomal dominant) | 6624 | 0.037 | -0.1734 | No |
| 7 | HES1 | HES1 StanfordSource, GeneCards | hairy and enhancer of split 1, (Drosophila) | 7864 | -0.001 | -0.2555 | No |
| 8 | HRASLS | HRASLS StanfordSource, GeneCards | HRAS-like suppressor | 10422 | -0.074 | -0.3963 | No |
| 9 | BDH | BDH StanfordSource, GeneCards | 3-hydroxybutyrate dehydrogenase (heart, mitochondrial) | 10893 | -0.089 | -0.3924 | Yes |
| 10 | CENTB2 | CENTB2 StanfordSource, GeneCards | centaurin, beta 2 | 10903 | -0.090 | -0.3575 | Yes |
| 11 | CPN2 | CPN2 StanfordSource, GeneCards | carboxypeptidase N, polypeptide 2, 83kD | 11682 | -0.117 | -0.3632 | Yes |
| 12 | PAK2 | PAK2 StanfordSource, GeneCards | p21 (CDKN1A)-activated kinase 2 | 11832 | -0.123 | -0.3248 | Yes |
| 13 | RPL35A | RPL35A StanfordSource, GeneCards | ribosomal protein L35a | 12271 | -0.140 | -0.2988 | Yes |
| 14 | TFRC | TFRC StanfordSource, GeneCards | transferrin receptor (p90, CD71) | 13213 | -0.183 | -0.2894 | Yes |
| 15 | NCBP2 | NCBP2 StanfordSource, GeneCards | nuclear cap binding protein subunit 2, 20kDa | 13367 | -0.192 | -0.2239 | Yes |
| 16 | SENP5 | SENP5 StanfordSource, GeneCards | SUMO1/sentrin specific protease 5 | 13927 | -0.231 | -0.1702 | Yes |
| 17 | PPP1R2 | PPP1R2 StanfordSource, GeneCards | protein phosphatase 1, regulatory (inhibitor) subunit 2 | 14467 | -0.284 | -0.0944 | Yes |
| 18 | MFI2 | MFI2 StanfordSource, GeneCards | antigen p97 (melanoma associated) identified by monoclonal antibodies 133.2 and 96.5 | 14781 | -0.339 | 0.0182 | Yes |