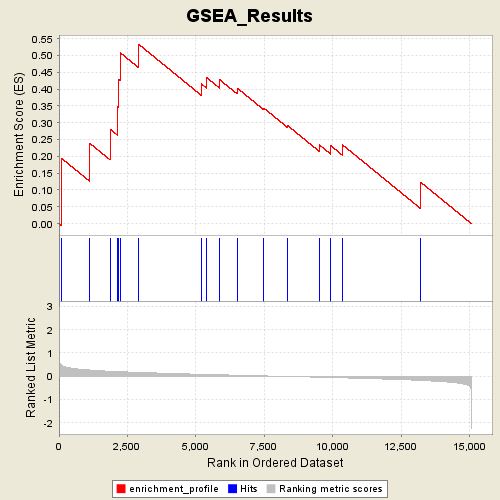
Profile of the Running ES Score & Positions of GeneSet Members on the Rank Ordered List
| Dataset | Gender_collapsed.gct |
| Phenotype | MALE |
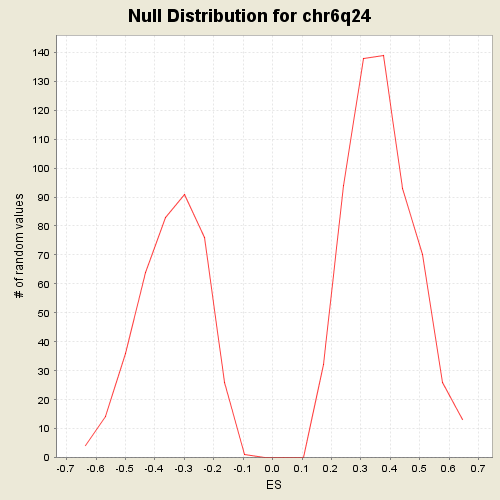
| GeneSet | C1.symbols.gmt#chr6q24 |
| Enrichment Score (ES) | 0.53311527 |
| Normalized Enrichment Score (NES) | 1.44958 |
| Nominal p-value | 0.08264463 |
| FDR q-value | 0.9409502 |
| FWER p-Value | 0.809 |
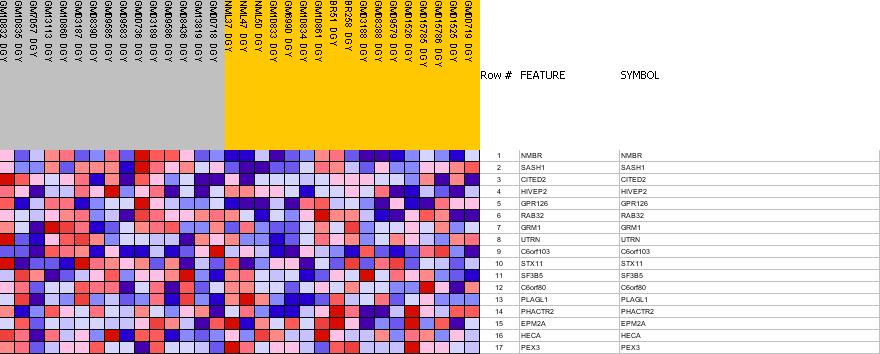
| PROBE | GENE SYMBOL | GENE_TITLE | RANK IN GENE LIST | RANK METRIC SCORE | RES | CORE_ENRICHMENT | |
|---|---|---|---|---|---|---|---|
| 1 | NMBR | NMBR StanfordSource, GeneCards | neuromedin B receptor | 104 | 0.465 | 0.1934 | Yes |
| 2 | SASH1 | SASH1 StanfordSource, GeneCards | SAM and SH3 domain containing 1 | 1128 | 0.262 | 0.2385 | Yes |
| 3 | CITED2 | CITED2 StanfordSource, GeneCards | Cbp/p300-interacting transactivator, with Glu/Asp-rich carboxy-terminal domain, 2 | 1869 | 0.211 | 0.2804 | Yes |
| 4 | HIVEP2 | HIVEP2 StanfordSource, GeneCards | human immunodeficiency virus type I enhancer binding protein 2 | 2147 | 0.196 | 0.3467 | Yes |
| 5 | GPR126 | GPR126 StanfordSource, GeneCards | G protein-coupled receptor 126 | 2167 | 0.196 | 0.4299 | Yes |
| 6 | RAB32 | RAB32 StanfordSource, GeneCards | RAB32, member RAS oncogene family | 2250 | 0.192 | 0.5072 | Yes |
| 7 | GRM1 | GRM1 StanfordSource, GeneCards | glutamate receptor, metabotropic 1 | 2911 | 0.162 | 0.5331 | Yes |
| 8 | UTRN | UTRN StanfordSource, GeneCards | utrophin (homologous to dystrophin) | 5191 | 0.080 | 0.4159 | No |
| 9 | C6orf103 | C6orf103 StanfordSource, GeneCards | chromosome 6 open reading frame 103 | 5386 | 0.073 | 0.4345 | No |
| 10 | STX11 | STX11 StanfordSource, GeneCards | syntaxin 11 | 5876 | 0.059 | 0.4273 | No |
| 11 | SF3B5 | SF3B5 StanfordSource, GeneCards | splicing factor 3b, subunit 5, 10kDa | 6503 | 0.040 | 0.4031 | No |
| 12 | C6orf80 | C6orf80 StanfordSource, GeneCards | chromosome 6 open reading frame 80 | 7483 | 0.011 | 0.3430 | No |
| 13 | PLAGL1 | PLAGL1 StanfordSource, GeneCards | pleiomorphic adenoma gene-like 1 | 8353 | -0.014 | 0.2910 | No |
| 14 | PHACTR2 | PHACTR2 StanfordSource, GeneCards | phosphatase and actin regulator 2 | 9497 | -0.046 | 0.2347 | No |
| 15 | EPM2A | EPM2A StanfordSource, GeneCards | epilepsy, progressive myoclonus type 2A, Lafora disease (laforin) | 9925 | -0.058 | 0.2315 | No |
| 16 | HECA | HECA StanfordSource, GeneCards | headcase homolog (Drosophila) | 10353 | -0.072 | 0.2341 | No |
| 17 | PEX3 | PEX3 StanfordSource, GeneCards | peroxisomal biogenesis factor 3 | 13202 | -0.182 | 0.1232 | No |