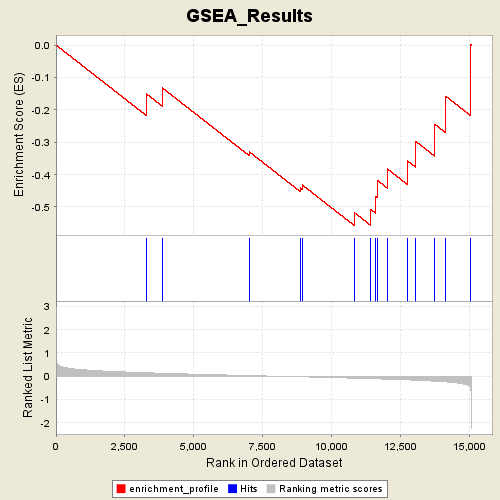
Profile of the Running ES Score & Positions of GeneSet Members on the Rank Ordered List
| Dataset | Gender_collapsed.gct |
| Phenotype | FEMALE |
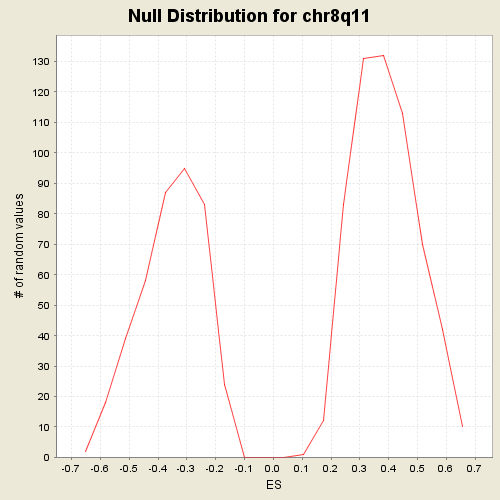
| GeneSet | C1.symbols.gmt#chr8q11 |
| Enrichment Score (ES) | -0.55873287 |
| Normalized Enrichment Score (NES) | -1.5731183 |
| Nominal p-value | 0.039408866 |
| FDR q-value | 0.6945129 |
| FWER p-Value | 0.53 |
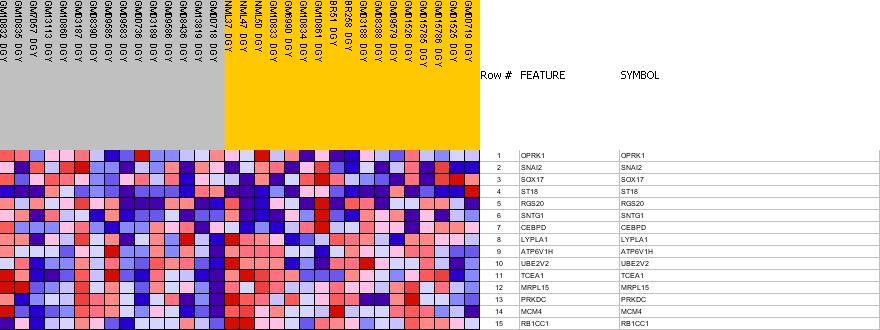
| PROBE | GENE SYMBOL | GENE_TITLE | RANK IN GENE LIST | RANK METRIC SCORE | RES | CORE_ENRICHMENT | |
|---|---|---|---|---|---|---|---|
| 1 | OPRK1 | OPRK1 StanfordSource, GeneCards | opioid receptor, kappa 1 | 3273 | 0.146 | -0.1504 | No |
| 2 | SNAI2 | SNAI2 StanfordSource, GeneCards | snail homolog 2 (Drosophila) | 3851 | 0.123 | -0.1321 | No |
| 3 | SOX17 | SOX17 StanfordSource, GeneCards | SRY (sex determining region Y)-box 17 | 7003 | 0.026 | -0.3295 | No |
| 4 | ST18 | ST18 StanfordSource, GeneCards | suppression of tumorigenicity 18 (breast carcinoma) (zinc finger protein) | 8852 | -0.026 | -0.4402 | No |
| 5 | RGS20 | RGS20 StanfordSource, GeneCards | regulator of G-protein signalling 20 | 8926 | -0.029 | -0.4319 | No |
| 6 | SNTG1 | SNTG1 StanfordSource, GeneCards | syntrophin, gamma 1 | 10834 | -0.087 | -0.5186 | Yes |
| 7 | CEBPD | CEBPD StanfordSource, GeneCards | CCAAT/enhancer binding protein (C/EBP), delta | 11396 | -0.107 | -0.5066 | Yes |
| 8 | LYPLA1 | LYPLA1 StanfordSource, GeneCards | lysophospholipase I | 11585 | -0.114 | -0.4668 | Yes |
| 9 | ATP6V1H | ATP6V1H StanfordSource, GeneCards | ATPase, H+ transporting, lysosomal 50/57kDa, V1 subunit H | 11649 | -0.116 | -0.4178 | Yes |
| 10 | UBE2V2 | UBE2V2 StanfordSource, GeneCards | ubiquitin-conjugating enzyme E2 variant 2 | 12008 | -0.130 | -0.3820 | Yes |
| 11 | TCEA1 | TCEA1 StanfordSource, GeneCards | transcription elongation factor A (SII), 1 | 12728 | -0.159 | -0.3567 | Yes |
| 12 | MRPL15 | MRPL15 StanfordSource, GeneCards | mitochondrial ribosomal protein L15 | 13045 | -0.175 | -0.2976 | Yes |
| 13 | PRKDC | PRKDC StanfordSource, GeneCards | protein kinase, DNA-activated, catalytic polypeptide | 13739 | -0.215 | -0.2448 | Yes |
| 14 | MCM4 | MCM4 StanfordSource, GeneCards | MCM4 minichromosome maintenance deficient 4 (S. cerevisiae) | 14127 | -0.246 | -0.1578 | Yes |
| 15 | RB1CC1 | RB1CC1 StanfordSource, GeneCards | RB1-inducible coiled-coil 1 | 15021 | -0.478 | 0.0023 | Yes |