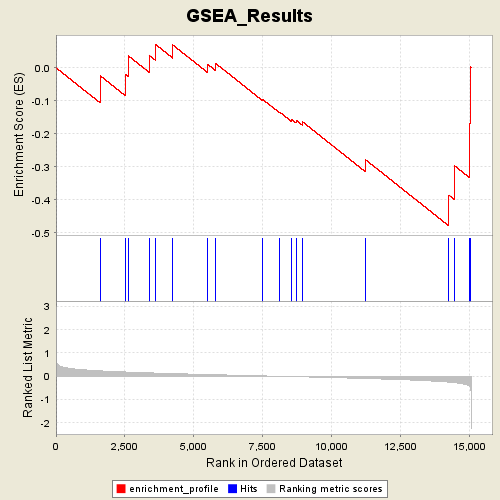
Profile of the Running ES Score & Positions of GeneSet Members on the Rank Ordered List
| Dataset | Gender_collapsed.gct |
| Phenotype | FEMALE |
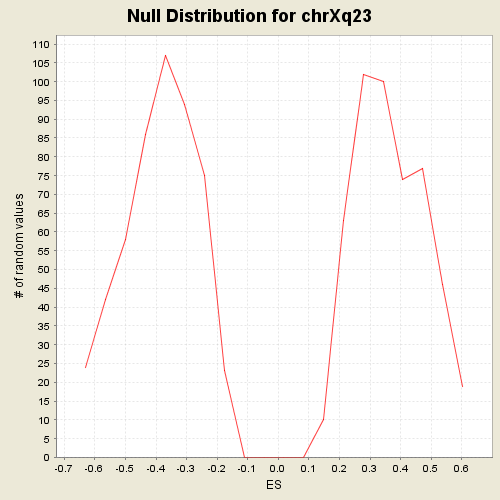
| GeneSet | C1.symbols.gmt#chrXq23 |
| Enrichment Score (ES) | -0.479806 |
| Normalized Enrichment Score (NES) | -1.2451109 |
| Nominal p-value | 0.22200392 |
| FDR q-value | 1.0 |
| FWER p-Value | 0.872 |
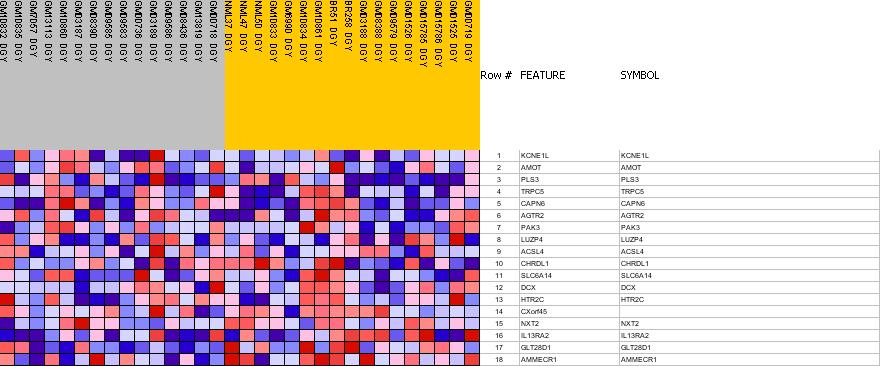
| PROBE | GENE SYMBOL | GENE_TITLE | RANK IN GENE LIST | RANK METRIC SCORE | RES | CORE_ENRICHMENT | |
|---|---|---|---|---|---|---|---|
| 1 | KCNE1L | KCNE1L StanfordSource, GeneCards | potassium voltage-gated channel, Isk-related family, member 1-like | 1603 | 0.227 | -0.0242 | No |
| 2 | AMOT | AMOT StanfordSource, GeneCards | angiomotin | 2518 | 0.178 | -0.0202 | No |
| 3 | PLS3 | PLS3 StanfordSource, GeneCards | plastin 3 (T isoform) | 2625 | 0.175 | 0.0362 | No |
| 4 | TRPC5 | TRPC5 StanfordSource, GeneCards | transient receptor potential cation channel, subfamily C, member 5 | 3394 | 0.142 | 0.0366 | No |
| 5 | CAPN6 | CAPN6 StanfordSource, GeneCards | calpain 6 | 3605 | 0.134 | 0.0712 | No |
| 6 | AGTR2 | AGTR2 StanfordSource, GeneCards | angiotensin II receptor, type 2 | 4236 | 0.110 | 0.0692 | No |
| 7 | PAK3 | PAK3 StanfordSource, GeneCards | p21 (CDKN1A)-activated kinase 3 | 5503 | 0.069 | 0.0101 | No |
| 8 | LUZP4 | LUZP4 StanfordSource, GeneCards | leucine zipper protein 4 | 5784 | 0.061 | 0.0136 | No |
| 9 | ACSL4 | ACSL4 StanfordSource, GeneCards | acyl-CoA synthetase long-chain family member 4 | 7494 | 0.011 | -0.0960 | No |
| 10 | CHRDL1 | CHRDL1 StanfordSource, GeneCards | chordin-like 1 | 8108 | -0.007 | -0.1343 | No |
| 11 | SLC6A14 | SLC6A14 StanfordSource, GeneCards | solute carrier family 6 (neurotransmitter transporter), member 14 | 8544 | -0.019 | -0.1565 | No |
| 12 | DCX | DCX StanfordSource, GeneCards | doublecortex; lissencephaly, X-linked (doublecortin) | 8705 | -0.023 | -0.1589 | No |
| 13 | HTR2C | HTR2C StanfordSource, GeneCards | 5-hydroxytryptamine (serotonin) receptor 2C | 8929 | -0.029 | -0.1633 | No |
| 14 | CXorf45 | 11224 | -0.102 | -0.2789 | No | ||
| 15 | NXT2 | NXT2 StanfordSource, GeneCards | nuclear transport factor 2-like export factor 2 | 14246 | -0.257 | -0.3864 | Yes |
| 16 | IL13RA2 | IL13RA2 StanfordSource, GeneCards | interleukin 13 receptor, alpha 2 | 14460 | -0.283 | -0.2979 | Yes |
| 17 | GLT28D1 | GLT28D1 StanfordSource, GeneCards | glycosyltransferase 28 domain containing 1 | 15008 | -0.456 | -0.1684 | Yes |
| 18 | AMMECR1 | AMMECR1 StanfordSource, GeneCards | Alport syndrome, mental retardation, midface hypoplasia and elliptocytosis chromosomal region, gene 1 | 15016 | -0.472 | 0.0026 | Yes |