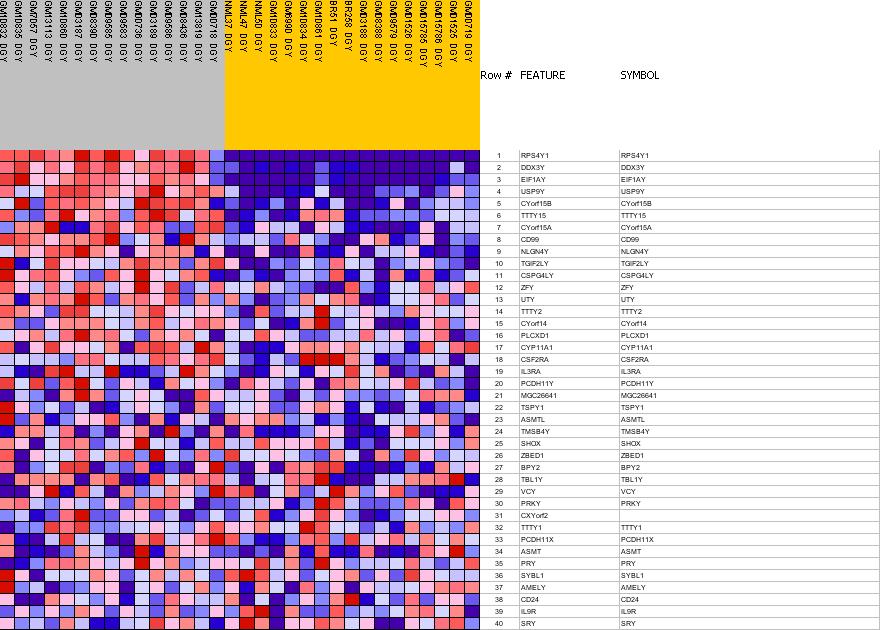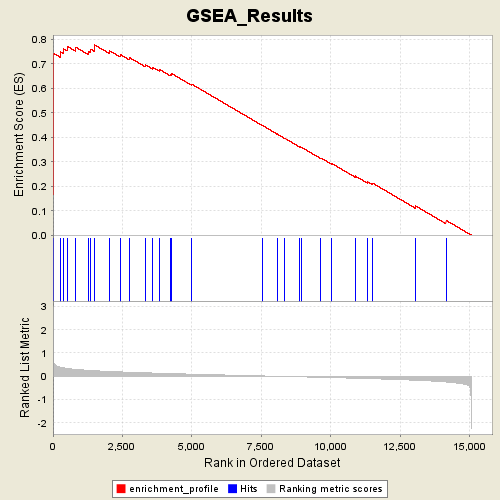
Profile of the Running ES Score & Positions of GeneSet Members on the Rank Ordered List
| Dataset | Gender_collapsed.gct |
| Phenotype | MALE |
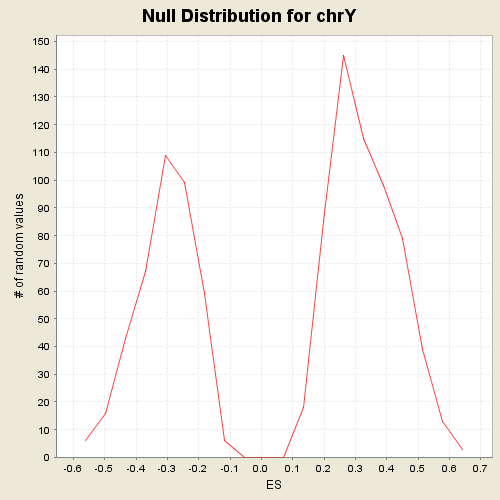
| GeneSet | C1.symbols.gmt#chrY |
| Enrichment Score (ES) | 0.7775844 |
| Normalized Enrichment Score (NES) | 2.3418906 |
| Nominal p-value | 0.0 |
| FDR q-value | 0.0 |
| FWER p-Value | 0.0 |
| PROBE | GENE SYMBOL | GENE_TITLE | RANK IN GENE LIST | RANK METRIC SCORE | RES | CORE_ENRICHMENT | |
|---|---|---|---|---|---|---|---|
| 1 | RPS4Y1 | RPS4Y1 StanfordSource, GeneCards | ribosomal protein S4, Y-linked 1 | 0 | 2.944 | 0.1674 | Yes |
| 2 | DDX3Y | DDX3Y StanfordSource, GeneCards | DEAD (Asp-Glu-Ala-Asp) box polypeptide 3, Y-linked | 1 | 1.837 | 0.2718 | Yes |
| 3 | EIF1AY | EIF1AY StanfordSource, GeneCards | eukaryotic translation initiation factor 1A, Y-linked | 3 | 1.713 | 0.3691 | Yes |
| 4 | USP9Y | USP9Y StanfordSource, GeneCards | ubiquitin specific protease 9, Y-linked (fat facets-like, Drosophila) | 4 | 1.524 | 0.4558 | Yes |
| 5 | CYorf15B | CYorf15B StanfordSource, GeneCards | chromosome Y open reading frame 15B | 5 | 0.993 | 0.5122 | Yes |
| 6 | TTTY15 | TTTY15 StanfordSource, GeneCards | testis-specific transcript, Y-linked 15 | 6 | 0.805 | 0.5579 | Yes |
| 7 | CYorf15A | CYorf15A StanfordSource, GeneCards | chromosome Y open reading frame 15A | 10 | 0.705 | 0.5978 | Yes |
| 8 | CD99 | CD99 StanfordSource, GeneCards | CD99 antigen | 11 | 0.703 | 0.6378 | Yes |
| 9 | NLGN4Y | NLGN4Y StanfordSource, GeneCards | neuroligin 4, Y linked | 12 | 0.686 | 0.6768 | Yes |
| 10 | TGIF2LY | TGIF2LY StanfordSource, GeneCards | TGFB-induced factor 2-like, Y-linked | 19 | 0.592 | 0.7101 | Yes |
| 11 | CSPG4LY | CSPG4LY StanfordSource, GeneCards | chondroitin sulfate proteoglycan 4-like, Y-linked | 26 | 0.571 | 0.7421 | Yes |
| 12 | ZFY | ZFY StanfordSource, GeneCards | zinc finger protein, Y-linked | 259 | 0.387 | 0.7486 | Yes |
| 13 | UTY | UTY StanfordSource, GeneCards | ubiquitously transcribed tetratricopeptide repeat gene, Y-linked | 388 | 0.358 | 0.7605 | Yes |
| 14 | TTTY2 | TTTY2 StanfordSource, GeneCards | testis-specific transcript, Y-linked 2 | 516 | 0.334 | 0.7710 | Yes |
| 15 | CYorf14 | CYorf14 StanfordSource, GeneCards | chromosome Y open reading frame 14 | 811 | 0.293 | 0.7681 | Yes |
| 16 | PLCXD1 | PLCXD1 StanfordSource, GeneCards | phosphatidylinositol-specific phospholipase C, X domain containing 1 | 1282 | 0.248 | 0.7509 | Yes |
| 17 | CYP11A1 | CYP11A1 StanfordSource, GeneCards | cytochrome P450, family 11, subfamily A, polypeptide 1 | 1359 | 0.242 | 0.7596 | Yes |
| 18 | CSF2RA | CSF2RA StanfordSource, GeneCards | colony stimulating factor 2 receptor, alpha, low-affinity (granulocyte-macrophage) | 1485 | 0.234 | 0.7646 | Yes |
| 19 | IL3RA | IL3RA StanfordSource, GeneCards | interleukin 3 receptor, alpha (low affinity) | 1490 | 0.234 | 0.7776 | Yes |
| 20 | PCDH11Y | PCDH11Y StanfordSource, GeneCards | protocadherin 11 Y-linked | 2034 | 0.202 | 0.7529 | No |
| 21 | MGC26641 | MGC26641 StanfordSource, GeneCards | RNA binding motif protein, Y-linked, family 2, pseudogene | 2415 | 0.183 | 0.7380 | No |
| 22 | TSPY1 | TSPY1 StanfordSource, GeneCards | testis specific protein, Y-linked 1 | 2754 | 0.169 | 0.7251 | No |
| 23 | ASMTL | ASMTL StanfordSource, GeneCards | acetylserotonin O-methyltransferase-like | 3317 | 0.145 | 0.6959 | No |
| 24 | TMSB4Y | TMSB4Y StanfordSource, GeneCards | thymosin, beta 4, Y-linked | 3586 | 0.134 | 0.6857 | No |
| 25 | SHOX | SHOX StanfordSource, GeneCards | short stature homeobox | 3833 | 0.125 | 0.6764 | No |
| 26 | ZBED1 | ZBED1 StanfordSource, GeneCards | zinc finger, BED-type containing 1 | 4232 | 0.110 | 0.6561 | No |
| 27 | BPY2 | BPY2 StanfordSource, GeneCards | basic charge, Y-linked, 2 | 4278 | 0.108 | 0.6593 | No |
| 28 | TBL1Y | TBL1Y StanfordSource, GeneCards | transducin (beta)-like 1Y-linked | 5002 | 0.086 | 0.6161 | No |
| 29 | VCY | VCY StanfordSource, GeneCards | variable charge, Y-linked | 7533 | 0.010 | 0.4481 | No |
| 30 | PRKY | PRKY StanfordSource, GeneCards | protein kinase, Y-linked | 8069 | -0.006 | 0.4128 | No |
| 31 | CXYorf2 | 8341 | -0.013 | 0.3955 | No | ||
| 32 | TTTY1 | TTTY1 StanfordSource, GeneCards | testis-specific transcript, Y-linked 1 | 8885 | -0.027 | 0.3609 | No |
| 33 | PCDH11X | PCDH11X StanfordSource, GeneCards | protocadherin 11 X-linked | 8951 | -0.029 | 0.3583 | No |
| 34 | ASMT | ASMT StanfordSource, GeneCards | acetylserotonin O-methyltransferase | 9649 | -0.050 | 0.3147 | No |
| 35 | PRY | PRY StanfordSource, GeneCards | PTPN13-like, Y-linked | 10019 | -0.061 | 0.2936 | No |
| 36 | SYBL1 | SYBL1 StanfordSource, GeneCards | synaptobrevin-like 1 | 10881 | -0.089 | 0.2413 | No |
| 37 | AMELY | AMELY StanfordSource, GeneCards | amelogenin, Y-linked | 11336 | -0.105 | 0.2171 | No |
| 38 | CD24 | CD24 StanfordSource, GeneCards | CD24 antigen (small cell lung carcinoma cluster 4 antigen) | 11513 | -0.112 | 0.2117 | No |
| 39 | IL9R | IL9R StanfordSource, GeneCards | interleukin 9 receptor | 13047 | -0.175 | 0.1196 | No |
| 40 | SRY | SRY StanfordSource, GeneCards | sex determining region Y | 14152 | -0.248 | 0.0601 | No |