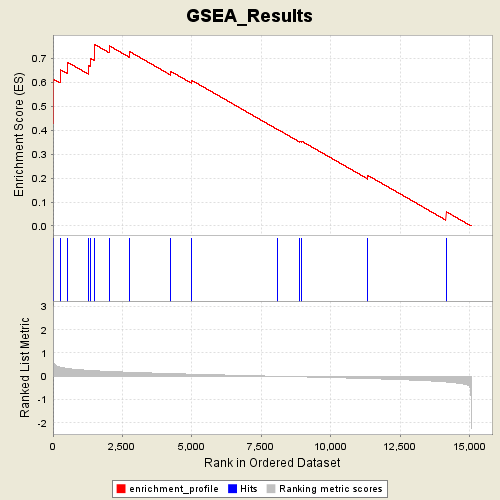
Profile of the Running ES Score & Positions of GeneSet Members on the Rank Ordered List
| Dataset | Gender_collapsed.gct |
| Phenotype | MALE |
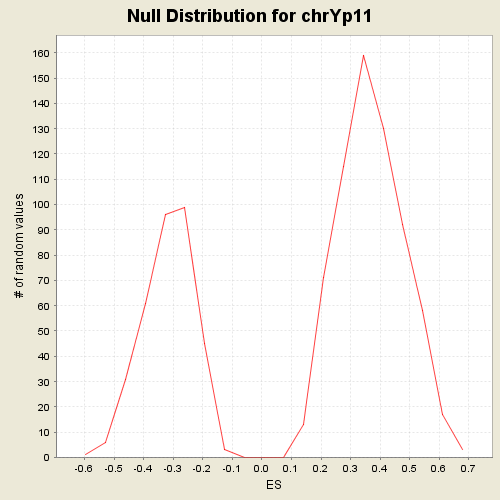
| GeneSet | C1.symbols.gmt#chrYp11 |
| Enrichment Score (ES) | 0.75901043 |
| Normalized Enrichment Score (NES) | 2.0459135 |
| Nominal p-value | 0.0 |
| FDR q-value | 0.0015003384 |
| FWER p-Value | 0.0030 |
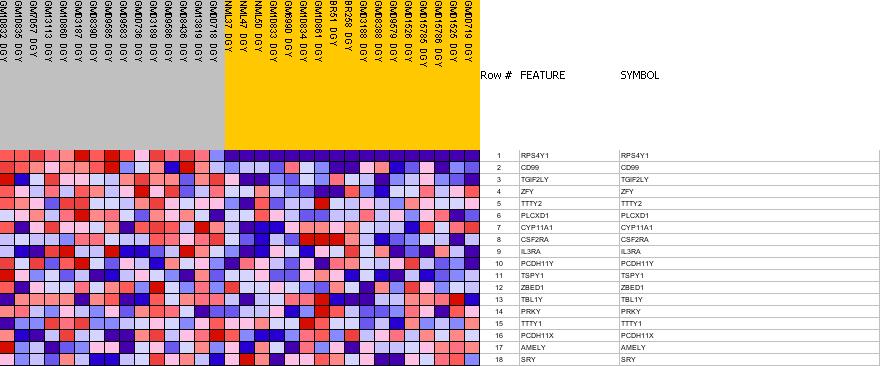
| PROBE | GENE SYMBOL | GENE_TITLE | RANK IN GENE LIST | RANK METRIC SCORE | RES | CORE_ENRICHMENT | |
|---|---|---|---|---|---|---|---|
| 1 | RPS4Y1 | RPS4Y1 StanfordSource, GeneCards | ribosomal protein S4, Y-linked 1 | 0 | 2.944 | 0.4266 | Yes |
| 2 | CD99 | CD99 StanfordSource, GeneCards | CD99 antigen | 11 | 0.703 | 0.5279 | Yes |
| 3 | TGIF2LY | TGIF2LY StanfordSource, GeneCards | TGFB-induced factor 2-like, Y-linked | 19 | 0.592 | 0.6132 | Yes |
| 4 | ZFY | ZFY StanfordSource, GeneCards | zinc finger protein, Y-linked | 259 | 0.387 | 0.6533 | Yes |
| 5 | TTTY2 | TTTY2 StanfordSource, GeneCards | testis-specific transcript, Y-linked 2 | 516 | 0.334 | 0.6846 | Yes |
| 6 | PLCXD1 | PLCXD1 StanfordSource, GeneCards | phosphatidylinositol-specific phospholipase C, X domain containing 1 | 1282 | 0.248 | 0.6698 | Yes |
| 7 | CYP11A1 | CYP11A1 StanfordSource, GeneCards | cytochrome P450, family 11, subfamily A, polypeptide 1 | 1359 | 0.242 | 0.6999 | Yes |
| 8 | CSF2RA | CSF2RA StanfordSource, GeneCards | colony stimulating factor 2 receptor, alpha, low-affinity (granulocyte-macrophage) | 1485 | 0.234 | 0.7254 | Yes |
| 9 | IL3RA | IL3RA StanfordSource, GeneCards | interleukin 3 receptor, alpha (low affinity) | 1490 | 0.234 | 0.7590 | Yes |
| 10 | PCDH11Y | PCDH11Y StanfordSource, GeneCards | protocadherin 11 Y-linked | 2034 | 0.202 | 0.7522 | No |
| 11 | TSPY1 | TSPY1 StanfordSource, GeneCards | testis specific protein, Y-linked 1 | 2754 | 0.169 | 0.7288 | No |
| 12 | ZBED1 | ZBED1 StanfordSource, GeneCards | zinc finger, BED-type containing 1 | 4232 | 0.110 | 0.6466 | No |
| 13 | TBL1Y | TBL1Y StanfordSource, GeneCards | transducin (beta)-like 1Y-linked | 5002 | 0.086 | 0.6079 | No |
| 14 | PRKY | PRKY StanfordSource, GeneCards | protein kinase, Y-linked | 8069 | -0.006 | 0.4048 | No |
| 15 | TTTY1 | TTTY1 StanfordSource, GeneCards | testis-specific transcript, Y-linked 1 | 8885 | -0.027 | 0.3546 | No |
| 16 | PCDH11X | PCDH11X StanfordSource, GeneCards | protocadherin 11 X-linked | 8951 | -0.029 | 0.3545 | No |
| 17 | AMELY | AMELY StanfordSource, GeneCards | amelogenin, Y-linked | 11336 | -0.105 | 0.2113 | No |
| 18 | SRY | SRY StanfordSource, GeneCards | sex determining region Y | 14152 | -0.248 | 0.0600 | No |