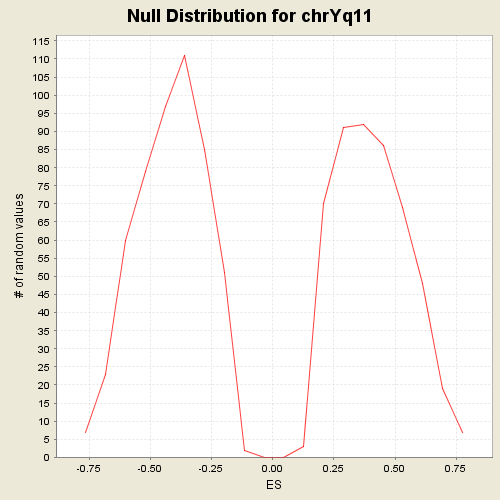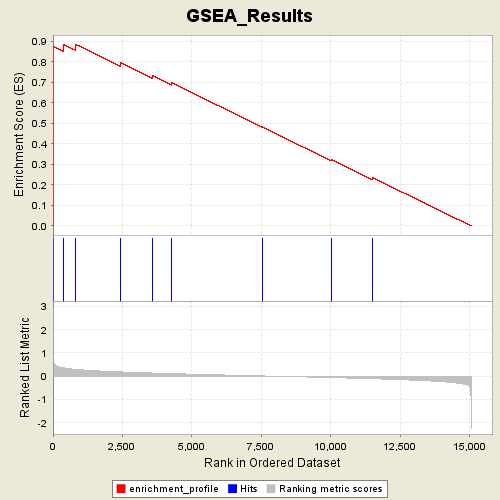
Profile of the Running ES Score & Positions of GeneSet Members on the Rank Ordered List
| Dataset | Gender_collapsed.gct |
| Phenotype | MALE |
| GeneSet | C1.symbols.gmt#chrYq11 |
| Enrichment Score (ES) | 0.8863413 |
| Normalized Enrichment Score (NES) | 2.1599464 |
| Nominal p-value | 0.0 |
| FDR q-value | 0.0 |
| FWER p-Value | 0.0 |
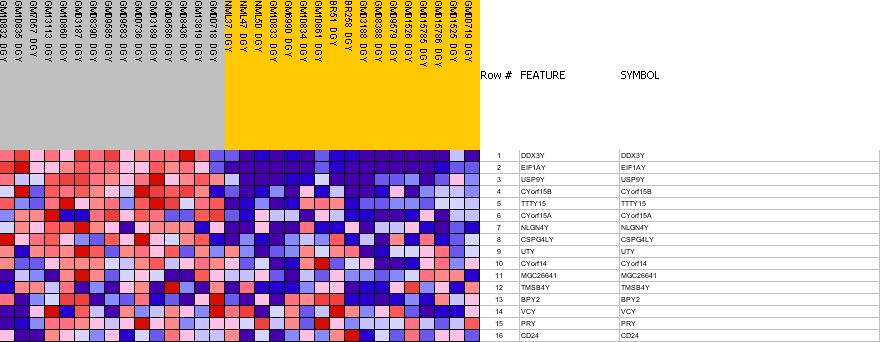
| PROBE | GENE SYMBOL | GENE_TITLE | RANK IN GENE LIST | RANK METRIC SCORE | RES | CORE_ENRICHMENT | |
|---|---|---|---|---|---|---|---|
| 1 | DDX3Y | DDX3Y StanfordSource, GeneCards | DEAD (Asp-Glu-Ala-Asp) box polypeptide 3, Y-linked | 1 | 1.837 | 0.1819 | Yes |
| 2 | EIF1AY | EIF1AY StanfordSource, GeneCards | eukaryotic translation initiation factor 1A, Y-linked | 3 | 1.713 | 0.3516 | Yes |
| 3 | USP9Y | USP9Y StanfordSource, GeneCards | ubiquitin specific protease 9, Y-linked (fat facets-like, Drosophila) | 4 | 1.524 | 0.5026 | Yes |
| 4 | CYorf15B | CYorf15B StanfordSource, GeneCards | chromosome Y open reading frame 15B | 5 | 0.993 | 0.6009 | Yes |
| 5 | TTTY15 | TTTY15 StanfordSource, GeneCards | testis-specific transcript, Y-linked 15 | 6 | 0.805 | 0.6807 | Yes |
| 6 | CYorf15A | CYorf15A StanfordSource, GeneCards | chromosome Y open reading frame 15A | 10 | 0.705 | 0.7503 | Yes |
| 7 | NLGN4Y | NLGN4Y StanfordSource, GeneCards | neuroligin 4, Y linked | 12 | 0.686 | 0.8182 | Yes |
| 8 | CSPG4LY | CSPG4LY StanfordSource, GeneCards | chondroitin sulfate proteoglycan 4-like, Y-linked | 26 | 0.571 | 0.8739 | Yes |
| 9 | UTY | UTY StanfordSource, GeneCards | ubiquitously transcribed tetratricopeptide repeat gene, Y-linked | 388 | 0.358 | 0.8853 | Yes |
| 10 | CYorf14 | CYorf14 StanfordSource, GeneCards | chromosome Y open reading frame 14 | 811 | 0.293 | 0.8863 | Yes |
| 11 | MGC26641 | MGC26641 StanfordSource, GeneCards | RNA binding motif protein, Y-linked, family 2, pseudogene | 2415 | 0.183 | 0.7979 | No |
| 12 | TMSB4Y | TMSB4Y StanfordSource, GeneCards | thymosin, beta 4, Y-linked | 3586 | 0.134 | 0.7334 | No |
| 13 | BPY2 | BPY2 StanfordSource, GeneCards | basic charge, Y-linked, 2 | 4278 | 0.108 | 0.6982 | No |
| 14 | VCY | VCY StanfordSource, GeneCards | variable charge, Y-linked | 7533 | 0.010 | 0.4829 | No |
| 15 | PRY | PRY StanfordSource, GeneCards | PTPN13-like, Y-linked | 10019 | -0.061 | 0.3237 | No |
| 16 | CD24 | CD24 StanfordSource, GeneCards | CD24 antigen (small cell lung carcinoma cluster 4 antigen) | 11513 | -0.112 | 0.2355 | No |