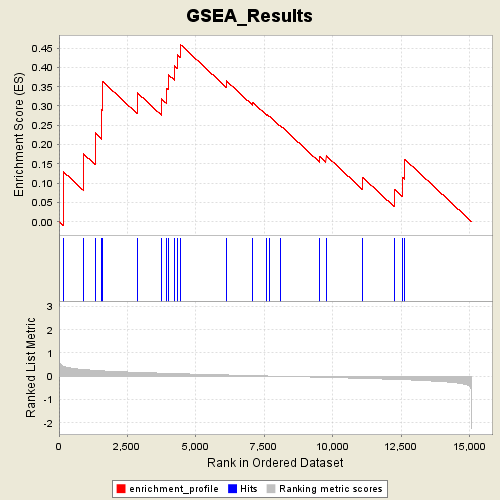
Profile of the Running ES Score & Positions of GeneSet Members on the Rank Ordered List
| Dataset | Gender_collapsed.gct |
| Phenotype | MALE |
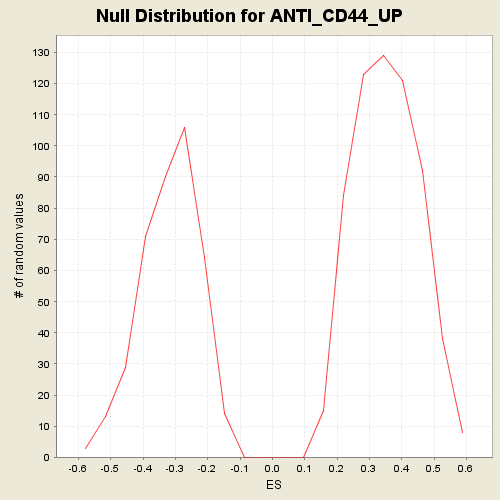
| GeneSet | C2.symbols.gmt#ANTI_CD44_UP |
| Enrichment Score (ES) | 0.45997512 |
| Normalized Enrichment Score (NES) | 1.3043686 |
| Nominal p-value | 0.15245901 |
| FDR q-value | 1.0 |
| FWER p-Value | 0.956 |
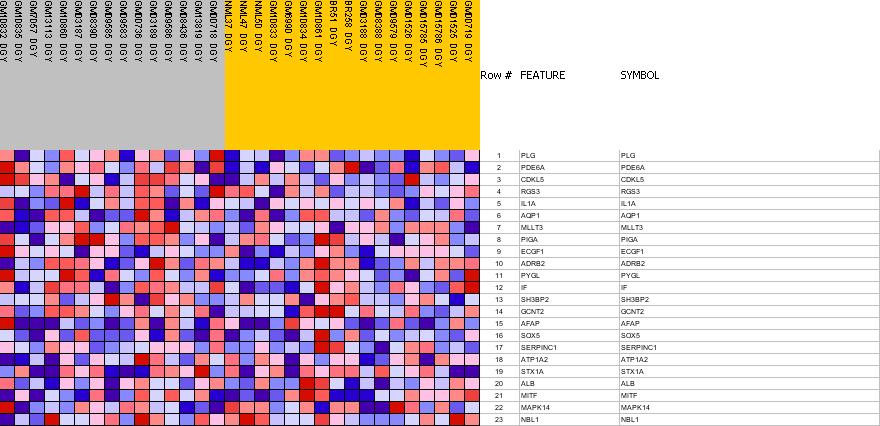
| PROBE | GENE SYMBOL | GENE_TITLE | RANK IN GENE LIST | RANK METRIC SCORE | RES | CORE_ENRICHMENT | |
|---|---|---|---|---|---|---|---|
| 1 | PLG | PLG StanfordSource, GeneCards | plasminogen | 171 | 0.419 | 0.1288 | Yes |
| 2 | PDE6A | PDE6A StanfordSource, GeneCards | phosphodiesterase 6A, cGMP-specific, rod, alpha | 892 | 0.284 | 0.1759 | Yes |
| 3 | CDKL5 | CDKL5 StanfordSource, GeneCards | cyclin-dependent kinase-like 5 | 1316 | 0.246 | 0.2298 | Yes |
| 4 | RGS3 | RGS3 StanfordSource, GeneCards | regulator of G-protein signalling 3 | 1568 | 0.229 | 0.2895 | Yes |
| 5 | IL1A | IL1A StanfordSource, GeneCards | interleukin 1, alpha | 1600 | 0.227 | 0.3633 | Yes |
| 6 | AQP1 | AQP1 StanfordSource, GeneCards | aquaporin 1 (channel-forming integral protein, 28kDa) | 2863 | 0.164 | 0.3342 | Yes |
| 7 | MLLT3 | MLLT3 StanfordSource, GeneCards | myeloid/lymphoid or mixed-lineage leukemia (trithorax homolog, Drosophila); translocated to, 3 | 3740 | 0.128 | 0.3187 | Yes |
| 8 | PIGA | PIGA StanfordSource, GeneCards | phosphatidylinositol glycan, class A (paroxysmal nocturnal hemoglobinuria) | 3939 | 0.120 | 0.3456 | Yes |
| 9 | ECGF1 | ECGF1 StanfordSource, GeneCards | endothelial cell growth factor 1 (platelet-derived) | 4002 | 0.118 | 0.3808 | Yes |
| 10 | ADRB2 | ADRB2 StanfordSource, GeneCards | adrenergic, beta-2-, receptor, surface | 4213 | 0.110 | 0.4037 | Yes |
| 11 | PYGL | PYGL StanfordSource, GeneCards | phosphorylase, glycogen; liver (Hers disease, glycogen storage disease type VI) | 4319 | 0.107 | 0.4324 | Yes |
| 12 | IF | IF StanfordSource, GeneCards | I factor (complement) | 4425 | 0.103 | 0.4600 | Yes |
| 13 | SH3BP2 | SH3BP2 StanfordSource, GeneCards | SH3-domain binding protein 2 | 6112 | 0.052 | 0.3652 | No |
| 14 | GCNT2 | GCNT2 StanfordSource, GeneCards | glucosaminyl (N-acetyl) transferase 2, I-branching enzyme | 7076 | 0.024 | 0.3093 | No |
| 15 | AFAP | AFAP StanfordSource, GeneCards | actin filament associated protein | 7590 | 0.009 | 0.2781 | No |
| 16 | SOX5 | SOX5 StanfordSource, GeneCards | SRY (sex determining region Y)-box 5 | 7685 | 0.005 | 0.2735 | No |
| 17 | SERPINC1 | SERPINC1 StanfordSource, GeneCards | serine (or cysteine) proteinase inhibitor, clade C (antithrombin), member 1 | 8071 | -0.006 | 0.2499 | No |
| 18 | ATP1A2 | ATP1A2 StanfordSource, GeneCards | ATPase, Na+/K+ transporting, alpha 2 (+) polypeptide | 9515 | -0.046 | 0.1694 | No |
| 19 | STX1A | STX1A StanfordSource, GeneCards | syntaxin 1A (brain) | 9748 | -0.053 | 0.1715 | No |
| 20 | ALB | ALB StanfordSource, GeneCards | albumin | 11094 | -0.097 | 0.1144 | No |
| 21 | MITF | MITF StanfordSource, GeneCards | microphthalmia-associated transcription factor | 12243 | -0.139 | 0.0844 | No |
| 22 | MAPK14 | MAPK14 StanfordSource, GeneCards | mitogen-activated protein kinase 14 | 12548 | -0.152 | 0.1149 | No |
| 23 | NBL1 | NBL1 StanfordSource, GeneCards | neuroblastoma, suppression of tumorigenicity 1 | 12625 | -0.155 | 0.1616 | No |