Profile of the Running ES Score & Positions of GeneSet Members on the Rank Ordered List
| Dataset | Gender_collapsed.gct |
| Phenotype | FEMALE |
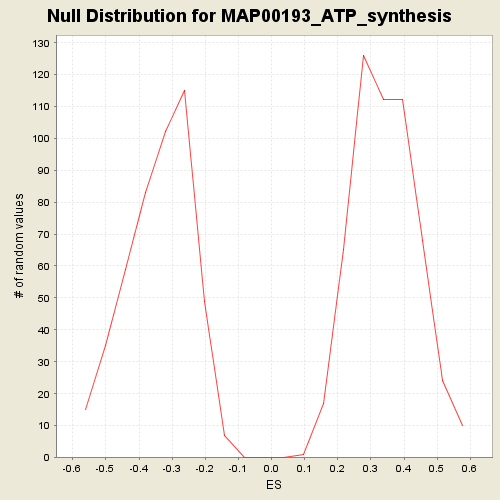
| GeneSet | C2.symbols.gmt#MAP00193_ATP_synthesis |
| Enrichment Score (ES) | -0.43544313 |
| Normalized Enrichment Score (NES) | -1.292141 |
| Nominal p-value | 0.18924731 |
| FDR q-value | 1.0 |
| FWER p-Value | 0.917 |
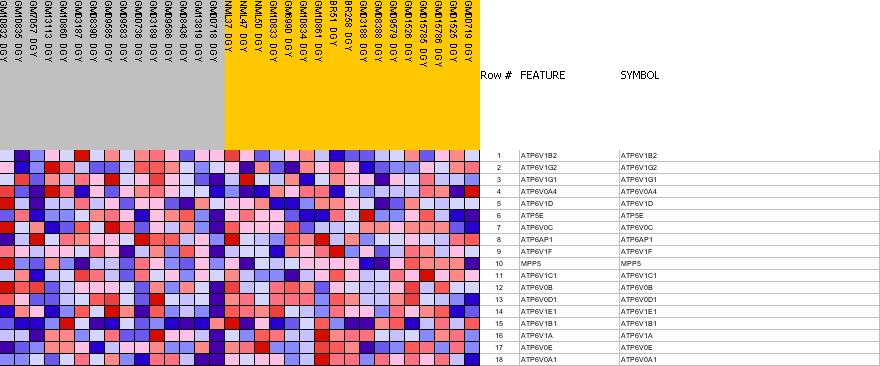
| PROBE | GENE SYMBOL | GENE_TITLE | RANK IN GENE LIST | RANK METRIC SCORE | RES | CORE_ENRICHMENT | |
|---|---|---|---|---|---|---|---|
| 1 | ATP6V1B2 | ATP6V1B2 StanfordSource, GeneCards | ATPase, H+ transporting, lysosomal 56/58kDa, V1 subunit B, isoform 2 | 2780 | 0.168 | -0.1156 | No |
| 2 | ATP6V1G2 | ATP6V1G2 StanfordSource, GeneCards | ATPase, H+ transporting, lysosomal 13kDa, V1 subunit G isoform 2 | 2963 | 0.160 | -0.0618 | No |
| 3 | ATP6V1G1 | ATP6V1G1 StanfordSource, GeneCards | ATPase, H+ transporting, lysosomal 13kDa, V1 subunit G isoform 1 | 3389 | 0.142 | -0.0316 | No |
| 4 | ATP6V0A4 | ATP6V0A4 StanfordSource, GeneCards | ATPase, H+ transporting, lysosomal V0 subunit a isoform 4 | 4474 | 0.102 | -0.0616 | No |
| 5 | ATP6V1D | ATP6V1D StanfordSource, GeneCards | ATPase, H+ transporting, lysosomal 34kDa, V1 subunit D | 5534 | 0.068 | -0.1040 | No |
| 6 | ATP5E | ATP5E StanfordSource, GeneCards | ATP synthase, H+ transporting, mitochondrial F1 complex, epsilon subunit | 7269 | 0.018 | -0.2119 | No |
| 7 | ATP6V0C | ATP6V0C StanfordSource, GeneCards | ATPase, H+ transporting, lysosomal 16kDa, V0 subunit c | 8689 | -0.022 | -0.2970 | No |
| 8 | ATP6AP1 | ATP6AP1 StanfordSource, GeneCards | ATPase, H+ transporting, lysosomal accessory protein 1 | 8761 | -0.024 | -0.2918 | No |
| 9 | ATP6V1F | ATP6V1F StanfordSource, GeneCards | ATPase, H+ transporting, lysosomal 14kDa, V1 subunit F | 10192 | -0.067 | -0.3594 | No |
| 10 | MPP5 | MPP5 StanfordSource, GeneCards | membrane protein, palmitoylated 5 (MAGUK p55 subfamily member 5) | 10277 | -0.069 | -0.3364 | No |
| 11 | ATP6V1C1 | ATP6V1C1 StanfordSource, GeneCards | ATPase, H+ transporting, lysosomal 42kDa, V1 subunit C, isoform 1 | 10543 | -0.078 | -0.3218 | No |
| 12 | ATP6V0B | ATP6V0B StanfordSource, GeneCards | ATPase, H+ transporting, lysosomal 21kDa, V0 subunit c'' | 10570 | -0.079 | -0.2910 | No |
| 13 | ATP6V0D1 | ATP6V0D1 StanfordSource, GeneCards | ATPase, H+ transporting, lysosomal 38kDa, V0 subunit d isoform 1 | 11840 | -0.123 | -0.3247 | No |
| 14 | ATP6V1E1 | ATP6V1E1 StanfordSource, GeneCards | ATPase, H+ transporting, lysosomal 31kDa, V1 subunit E isoform 1 | 13506 | -0.201 | -0.3526 | Yes |
| 15 | ATP6V1B1 | ATP6V1B1 StanfordSource, GeneCards | ATPase, H+ transporting, lysosomal 56/58kDa, V1 subunit B, isoform 1 (Renal tubular acidosis with deafness) | 13997 | -0.236 | -0.2877 | Yes |
| 16 | ATP6V1A | ATP6V1A StanfordSource, GeneCards | ATPase, H+ transporting, lysosomal 70kDa, V1 subunit A | 14200 | -0.252 | -0.1970 | Yes |
| 17 | ATP6V0E | ATP6V0E StanfordSource, GeneCards | ATPase, H+ transporting, lysosomal 9kDa, V0 subunit e | 14508 | -0.290 | -0.0979 | Yes |
| 18 | ATP6V0A1 | ATP6V0A1 StanfordSource, GeneCards | ATPase, H+ transporting, lysosomal V0 subunit a isoform 1 | 14717 | -0.325 | 0.0225 | Yes |