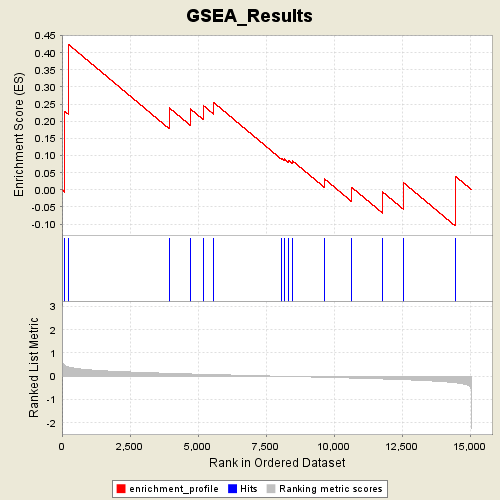
Profile of the Running ES Score & Positions of GeneSet Members on the Rank Ordered List
| Dataset | Gender_collapsed.gct |
| Phenotype | MALE |
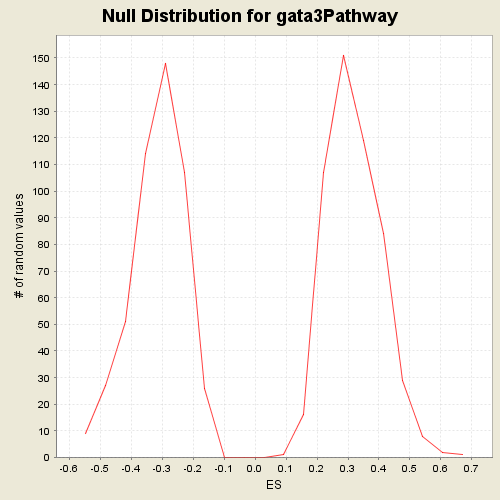
| GeneSet | C2.symbols.gmt#gata3Pathway |
| Enrichment Score (ES) | 0.42432135 |
| Normalized Enrichment Score (NES) | 1.3236971 |
| Nominal p-value | 0.1042471 |
| FDR q-value | 1.0 |
| FWER p-Value | 0.953 |
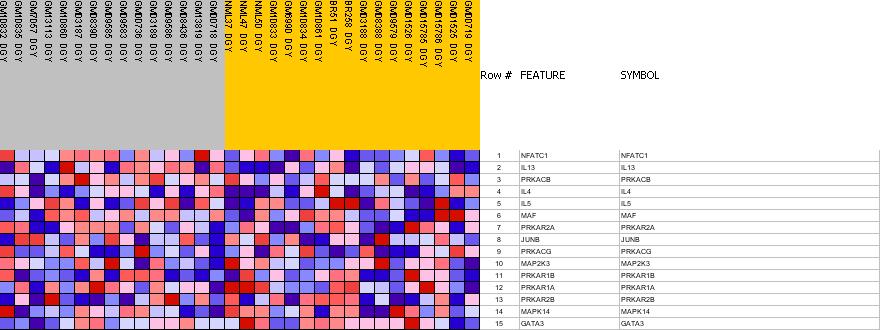
| PROBE | GENE SYMBOL | GENE_TITLE | RANK IN GENE LIST | RANK METRIC SCORE | RES | CORE_ENRICHMENT | |
|---|---|---|---|---|---|---|---|
| 1 | NFATC1 | NFATC1 StanfordSource, GeneCards | nuclear factor of activated T-cells, cytoplasmic, calcineurin-dependent 1 | 110 | 0.459 | 0.2285 | Yes |
| 2 | IL13 | IL13 StanfordSource, GeneCards | interleukin 13 | 235 | 0.397 | 0.4243 | Yes |
| 3 | PRKACB | PRKACB StanfordSource, GeneCards | protein kinase, cAMP-dependent, catalytic, beta | 3947 | 0.119 | 0.2390 | No |
| 4 | IL4 | IL4 StanfordSource, GeneCards | interleukin 4 | 4722 | 0.094 | 0.2359 | No |
| 5 | IL5 | IL5 StanfordSource, GeneCards | interleukin 5 (colony-stimulating factor, eosinophil) | 5187 | 0.080 | 0.2462 | No |
| 6 | MAF | MAF StanfordSource, GeneCards | v-maf musculoaponeurotic fibrosarcoma oncogene homolog (avian) | 5577 | 0.067 | 0.2546 | No |
| 7 | PRKAR2A | PRKAR2A StanfordSource, GeneCards | protein kinase, cAMP-dependent, regulatory, type II, alpha | 8079 | -0.006 | 0.0914 | No |
| 8 | JUNB | JUNB StanfordSource, GeneCards | jun B proto-oncogene | 8165 | -0.008 | 0.0900 | No |
| 9 | PRKACG | PRKACG StanfordSource, GeneCards | protein kinase, cAMP-dependent, catalytic, gamma | 8313 | -0.012 | 0.0867 | No |
| 10 | MAP2K3 | MAP2K3 StanfordSource, GeneCards | mitogen-activated protein kinase kinase 3 | 8461 | -0.017 | 0.0854 | No |
| 11 | PRKAR1B | PRKAR1B StanfordSource, GeneCards | protein kinase, cAMP-dependent, regulatory, type I, beta | 9635 | -0.050 | 0.0329 | No |
| 12 | PRKAR1A | PRKAR1A StanfordSource, GeneCards | protein kinase, cAMP-dependent, regulatory, type I, alpha (tissue specific extinguisher 1) | 10640 | -0.081 | 0.0080 | No |
| 13 | PRKAR2B | PRKAR2B StanfordSource, GeneCards | protein kinase, cAMP-dependent, regulatory, type II, beta | 11785 | -0.121 | -0.0059 | No |
| 14 | MAPK14 | MAPK14 StanfordSource, GeneCards | mitogen-activated protein kinase 14 | 12548 | -0.152 | 0.0214 | No |
| 15 | GATA3 | GATA3 StanfordSource, GeneCards | GATA binding protein 3 | 14457 | -0.282 | 0.0398 | No |