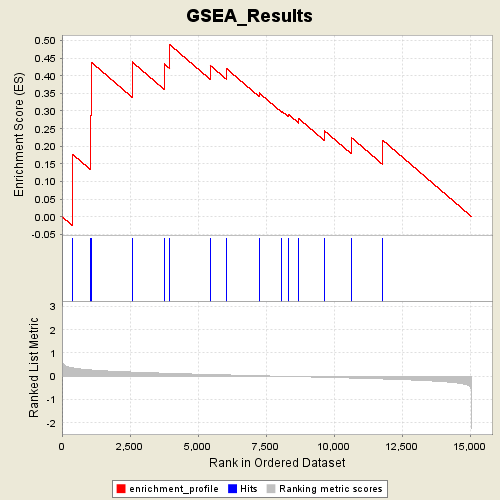
Profile of the Running ES Score & Positions of GeneSet Members on the Rank Ordered List
| Dataset | Gender_collapsed.gct |
| Phenotype | MALE |
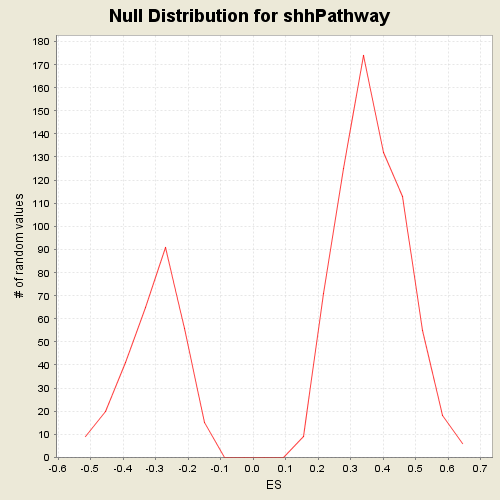
| GeneSet | C2.symbols.gmt#shhPathway |
| Enrichment Score (ES) | 0.48917383 |
| Normalized Enrichment Score (NES) | 1.3371416 |
| Nominal p-value | 0.112375535 |
| FDR q-value | 1.0 |
| FWER p-Value | 0.947 |
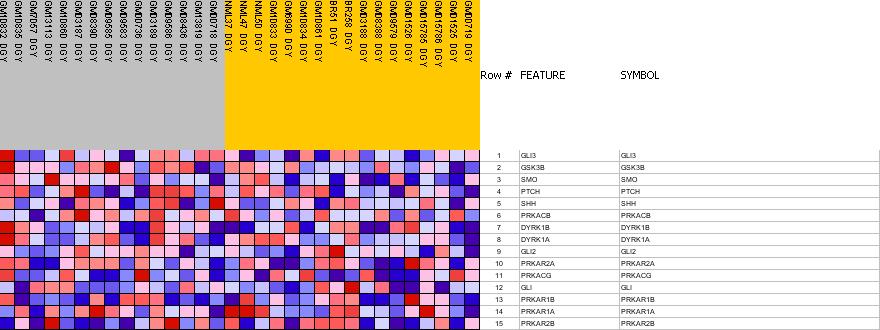
| PROBE | GENE SYMBOL | GENE_TITLE | RANK IN GENE LIST | RANK METRIC SCORE | RES | CORE_ENRICHMENT | |
|---|---|---|---|---|---|---|---|
| 1 | GLI3 | GLI3 StanfordSource, GeneCards | GLI-Kruppel family member GLI3 (Greig cephalopolysyndactyly syndrome) | 397 | 0.356 | 0.1766 | Yes |
| 2 | GSK3B | GSK3B StanfordSource, GeneCards | glycogen synthase kinase 3 beta | 1042 | 0.270 | 0.2880 | Yes |
| 3 | SMO | SMO StanfordSource, GeneCards | smoothened homolog (Drosophila) | 1074 | 0.268 | 0.4387 | Yes |
| 4 | PTCH | PTCH StanfordSource, GeneCards | patched homolog (Drosophila) | 2580 | 0.176 | 0.4391 | Yes |
| 5 | SHH | SHH StanfordSource, GeneCards | sonic hedgehog homolog (Drosophila) | 3761 | 0.127 | 0.4333 | Yes |
| 6 | PRKACB | PRKACB StanfordSource, GeneCards | protein kinase, cAMP-dependent, catalytic, beta | 3947 | 0.119 | 0.4892 | Yes |
| 7 | DYRK1B | DYRK1B StanfordSource, GeneCards | dual-specificity tyrosine-(Y)-phosphorylation regulated kinase 1B | 5468 | 0.070 | 0.4282 | No |
| 8 | DYRK1A | DYRK1A StanfordSource, GeneCards | dual-specificity tyrosine-(Y)-phosphorylation regulated kinase 1A | 6054 | 0.054 | 0.4199 | No |
| 9 | GLI2 | GLI2 StanfordSource, GeneCards | GLI-Kruppel family member GLI2 | 7251 | 0.019 | 0.3511 | No |
| 10 | PRKAR2A | PRKAR2A StanfordSource, GeneCards | protein kinase, cAMP-dependent, regulatory, type II, alpha | 8079 | -0.006 | 0.2996 | No |
| 11 | PRKACG | PRKACG StanfordSource, GeneCards | protein kinase, cAMP-dependent, catalytic, gamma | 8313 | -0.012 | 0.2912 | No |
| 12 | GLI | GLI StanfordSource, GeneCards | glioma-associated oncogene homolog (zinc finger protein) | 8710 | -0.023 | 0.2779 | No |
| 13 | PRKAR1B | PRKAR1B StanfordSource, GeneCards | protein kinase, cAMP-dependent, regulatory, type I, beta | 9635 | -0.050 | 0.2448 | No |
| 14 | PRKAR1A | PRKAR1A StanfordSource, GeneCards | protein kinase, cAMP-dependent, regulatory, type I, alpha (tissue specific extinguisher 1) | 10640 | -0.081 | 0.2245 | No |
| 15 | PRKAR2B | PRKAR2B StanfordSource, GeneCards | protein kinase, cAMP-dependent, regulatory, type II, beta | 11785 | -0.121 | 0.2174 | No |