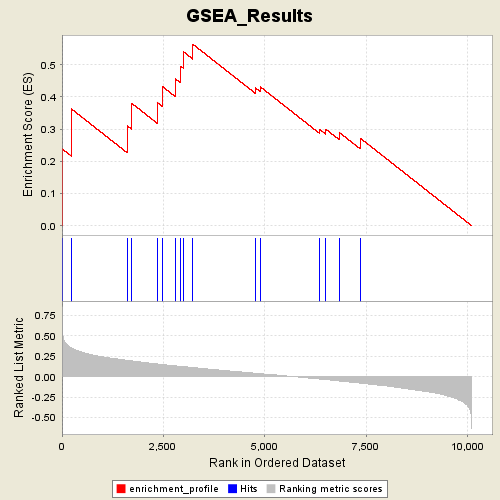
Profile of the Running ES Score & Positions of GeneSet Members on the Rank Ordered List
| Dataset | p53_full_useme_maxed_cs.gct |
| Phenotype | WT |
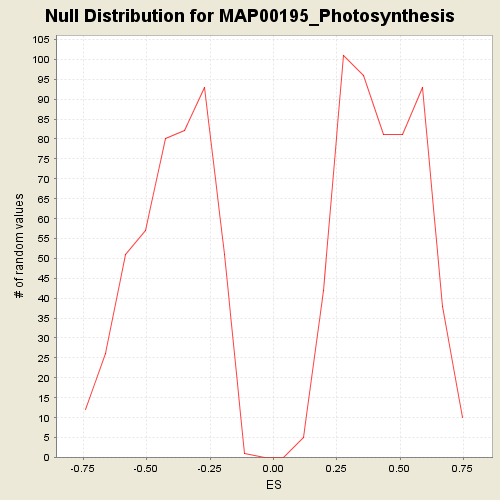
| GeneSet | s2.symbols.gmt#MAP00195_Photosynthesis |
| Enrichment Score (ES) | 0.56370884 |
| Normalized Enrichment Score (NES) | 1.3141869 |
| Nominal p-value | 0.2285192 |
| FDR q-value | 1.0 |
| FWER p-Value | 1.0 |
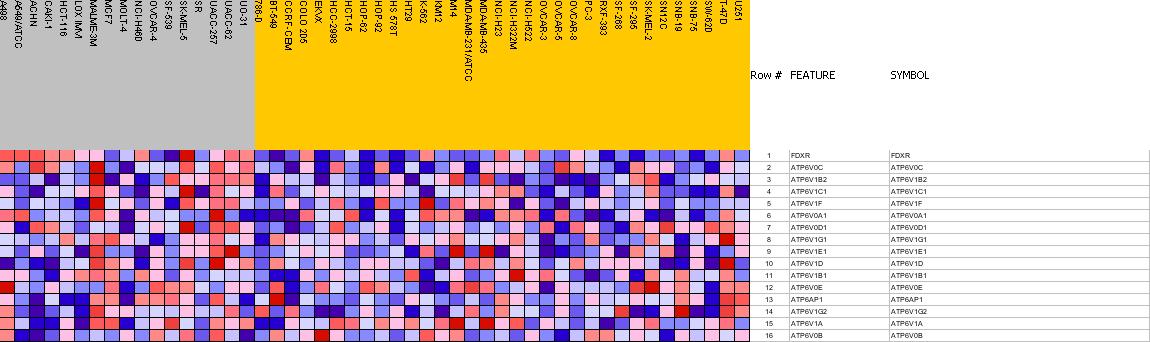
| PROBE | GENE SYMBOL | GENE_TITLE | RANK IN GENE LIST | RANK METRIC SCORE | RES | CORE_ENRICHMENT | |
|---|---|---|---|---|---|---|---|
| 1 | FDXR | FDXR StanfordSource, GeneCards | ferredoxin reductase | 8 | 0.568 | 0.2385 | Yes |
| 2 | ATP6V0C | ATP6V0C StanfordSource, GeneCards | ATPase, H+ transporting, lysosomal 16kDa, V0 subunit c | 233 | 0.348 | 0.3629 | Yes |
| 3 | ATP6V1B2 | ATP6V1B2 StanfordSource, GeneCards | ATPase, H+ transporting, lysosomal 56/58kDa, V1 subunit B, isoform 2 | 1604 | 0.199 | 0.3110 | Yes |
| 4 | ATP6V1C1 | ATP6V1C1 StanfordSource, GeneCards | ATPase, H+ transporting, lysosomal 42kDa, V1 subunit C, isoform 1 | 1722 | 0.192 | 0.3802 | Yes |
| 5 | ATP6V1F | ATP6V1F StanfordSource, GeneCards | ATPase, H+ transporting, lysosomal 14kDa, V1 subunit F | 2351 | 0.154 | 0.3829 | Yes |
| 6 | ATP6V0A1 | ATP6V0A1 StanfordSource, GeneCards | ATPase, H+ transporting, lysosomal V0 subunit a isoform 1 | 2490 | 0.147 | 0.4312 | Yes |
| 7 | ATP6V0D1 | ATP6V0D1 StanfordSource, GeneCards | ATPase, H+ transporting, lysosomal 38kDa, V0 subunit d isoform 1 | 2791 | 0.131 | 0.4567 | Yes |
| 8 | ATP6V1G1 | ATP6V1G1 StanfordSource, GeneCards | ATPase, H+ transporting, lysosomal 13kDa, V1 subunit G isoform 1 | 2924 | 0.125 | 0.4962 | Yes |
| 9 | ATP6V1E1 | ATP6V1E1 StanfordSource, GeneCards | ATPase, H+ transporting, lysosomal 31kDa, V1 subunit E isoform 1 | 2996 | 0.122 | 0.5405 | Yes |
| 10 | ATP6V1D | ATP6V1D StanfordSource, GeneCards | ATPase, H+ transporting, lysosomal 34kDa, V1 subunit D | 3230 | 0.110 | 0.5637 | Yes |
| 11 | ATP6V1B1 | ATP6V1B1 StanfordSource, GeneCards | ATPase, H+ transporting, lysosomal 56/58kDa, V1 subunit B, isoform 1 (Renal tubular acidosis with deafness) | 4774 | 0.041 | 0.4279 | No |
| 12 | ATP6V0E | ATP6V0E StanfordSource, GeneCards | ATPase, H+ transporting, lysosomal 9kDa, V0 subunit e | 4888 | 0.036 | 0.4318 | No |
| 13 | ATP6AP1 | ATP6AP1 StanfordSource, GeneCards | ATPase, H+ transporting, lysosomal accessory protein 1 | 6362 | -0.030 | 0.2985 | No |
| 14 | ATP6V1G2 | ATP6V1G2 StanfordSource, GeneCards | ATPase, H+ transporting, lysosomal 13kDa, V1 subunit G isoform 2 | 6509 | -0.037 | 0.2997 | No |
| 15 | ATP6V1A | ATP6V1A StanfordSource, GeneCards | ATPase, H+ transporting, lysosomal 70kDa, V1 subunit A | 6844 | -0.054 | 0.2892 | No |
| 16 | ATP6V0B | ATP6V0B StanfordSource, GeneCards | ATPase, H+ transporting, lysosomal 21kDa, V0 subunit c'' | 7352 | -0.080 | 0.2724 | No |