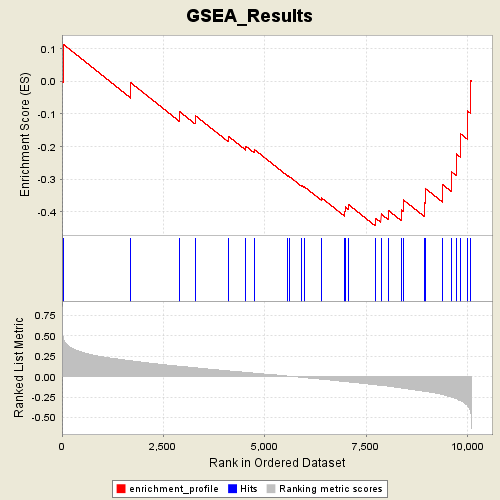
Profile of the Running ES Score & Positions of GeneSet Members on the Rank Ordered List
| Dataset | p53_full_useme_maxed_cs.gct |
| Phenotype | MUT |
| GeneSet | s2.symbols.gmt#ST_ERK1_ERK2_MAPK_Pathway |
| Enrichment Score (ES) | -0.44366202 |
| Normalized Enrichment Score (NES) | -1.5045457 |
| Nominal p-value | 0.022540983 |
| FDR q-value | 0.5313154 |
| FWER p-Value | 0.966 |
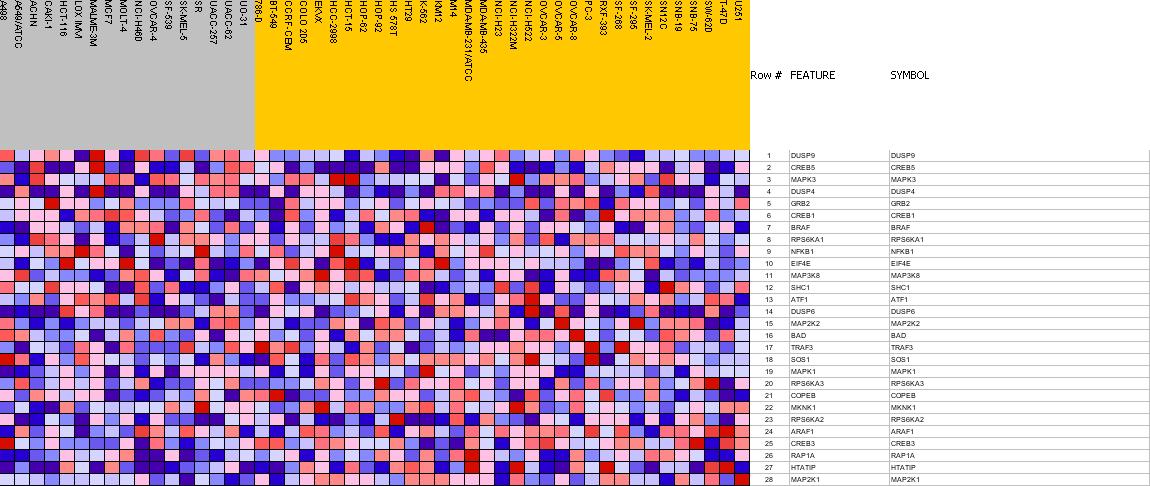
| PROBE | GENE SYMBOL | GENE_TITLE | RANK IN GENE LIST | RANK METRIC SCORE | RES | CORE_ENRICHMENT | |
|---|---|---|---|---|---|---|---|
| 1 | DUSP9 | DUSP9 StanfordSource, GeneCards | dual specificity phosphatase 9 | 33 | 0.479 | 0.1138 | No |
| 2 | CREB5 | CREB5 StanfordSource, GeneCards | cAMP responsive element binding protein 5 | 1697 | 0.193 | -0.0040 | No |
| 3 | MAPK3 | MAPK3 StanfordSource, GeneCards | mitogen-activated protein kinase 3 | 2905 | 0.125 | -0.0932 | No |
| 4 | DUSP4 | DUSP4 StanfordSource, GeneCards | dual specificity phosphatase 4 | 3283 | 0.108 | -0.1043 | No |
| 5 | GRB2 | GRB2 StanfordSource, GeneCards | growth factor receptor-bound protein 2 | 4102 | 0.070 | -0.1685 | No |
| 6 | CREB1 | CREB1 StanfordSource, GeneCards | cAMP responsive element binding protein 1 | 4535 | 0.051 | -0.1988 | No |
| 7 | BRAF | BRAF StanfordSource, GeneCards | v-raf murine sarcoma viral oncogene homolog B1 | 4737 | 0.043 | -0.2084 | No |
| 8 | RPS6KA1 | RPS6KA1 StanfordSource, GeneCards | ribosomal protein S6 kinase, 90kDa, polypeptide 1 | 5571 | 0.006 | -0.2895 | No |
| 9 | NFKB1 | NFKB1 StanfordSource, GeneCards | nuclear factor of kappa light polypeptide gene enhancer in B-cells 1 (p105) | 5616 | 0.004 | -0.2929 | No |
| 10 | EIF4E | EIF4E StanfordSource, GeneCards | eukaryotic translation initiation factor 4E | 5917 | -0.009 | -0.3204 | No |
| 11 | MAP3K8 | MAP3K8 StanfordSource, GeneCards | mitogen-activated protein kinase kinase kinase 8 | 5985 | -0.012 | -0.3241 | No |
| 12 | SHC1 | SHC1 StanfordSource, GeneCards | SHC (Src homology 2 domain containing) transforming protein 1 | 6401 | -0.032 | -0.3575 | No |
| 13 | ATF1 | ATF1 StanfordSource, GeneCards | activating transcription factor 1 | 6974 | -0.060 | -0.3996 | No |
| 14 | DUSP6 | DUSP6 StanfordSource, GeneCards | dual specificity phosphatase 6 | 6981 | -0.060 | -0.3855 | No |
| 15 | MAP2K2 | MAP2K2 StanfordSource, GeneCards | mitogen-activated protein kinase kinase 2 | 7065 | -0.065 | -0.3779 | No |
| 16 | BAD | BAD StanfordSource, GeneCards | BCL2-antagonist of cell death | 7728 | -0.099 | -0.4193 | Yes |
| 17 | TRAF3 | TRAF3 StanfordSource, GeneCards | TNF receptor-associated factor 3 | 7867 | -0.108 | -0.4067 | Yes |
| 18 | SOS1 | SOS1 StanfordSource, GeneCards | son of sevenless homolog 1 (Drosophila) | 8043 | -0.116 | -0.3956 | Yes |
| 19 | MAPK1 | MAPK1 StanfordSource, GeneCards | mitogen-activated protein kinase 1 | 8361 | -0.139 | -0.3931 | Yes |
| 20 | RPS6KA3 | RPS6KA3 StanfordSource, GeneCards | ribosomal protein S6 kinase, 90kDa, polypeptide 3 | 8418 | -0.143 | -0.3637 | Yes |
| 21 | COPEB | COPEB StanfordSource, GeneCards | core promoter element binding protein | 8945 | -0.179 | -0.3720 | Yes |
| 22 | MKNK1 | MKNK1 StanfordSource, GeneCards | MAP kinase-interacting serine/threonine kinase 1 | 8975 | -0.183 | -0.3301 | Yes |
| 23 | RPS6KA2 | RPS6KA2 StanfordSource, GeneCards | ribosomal protein S6 kinase, 90kDa, polypeptide 2 | 9391 | -0.220 | -0.3175 | Yes |
| 24 | ARAF1 | ARAF1 StanfordSource, GeneCards | v-raf murine sarcoma 3611 viral oncogene homolog 1 | 9608 | -0.250 | -0.2778 | Yes |
| 25 | CREB3 | CREB3 StanfordSource, GeneCards | cAMP responsive element binding protein 3 | 9719 | -0.271 | -0.2225 | Yes |
| 26 | RAP1A | RAP1A StanfordSource, GeneCards | RAP1A, member of RAS oncogene family | 9828 | -0.297 | -0.1607 | Yes |
| 27 | HTATIP | HTATIP StanfordSource, GeneCards | HIV-1 Tat interactive protein, 60kDa | 10002 | -0.356 | -0.0908 | Yes |
| 28 | MAP2K1 | MAP2K1 StanfordSource, GeneCards | mitogen-activated protein kinase kinase 1 | 10067 | -0.410 | 0.0032 | Yes |