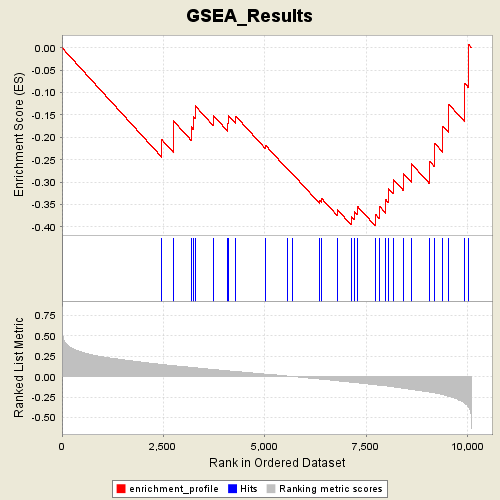
Profile of the Running ES Score & Positions of GeneSet Members on the Rank Ordered List
| Dataset | p53_full_useme_maxed_cs.gct |
| Phenotype | MUT |
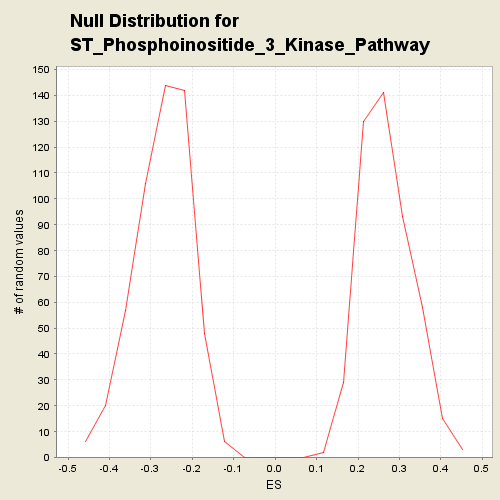
| GeneSet | s2.symbols.gmt#ST_Phosphoinositide_3_Kinase_Pathway |
| Enrichment Score (ES) | -0.39783144 |
| Normalized Enrichment Score (NES) | -1.4747753 |
| Nominal p-value | 0.02457467 |
| FDR q-value | 0.5342453 |
| FWER p-Value | 0.982 |
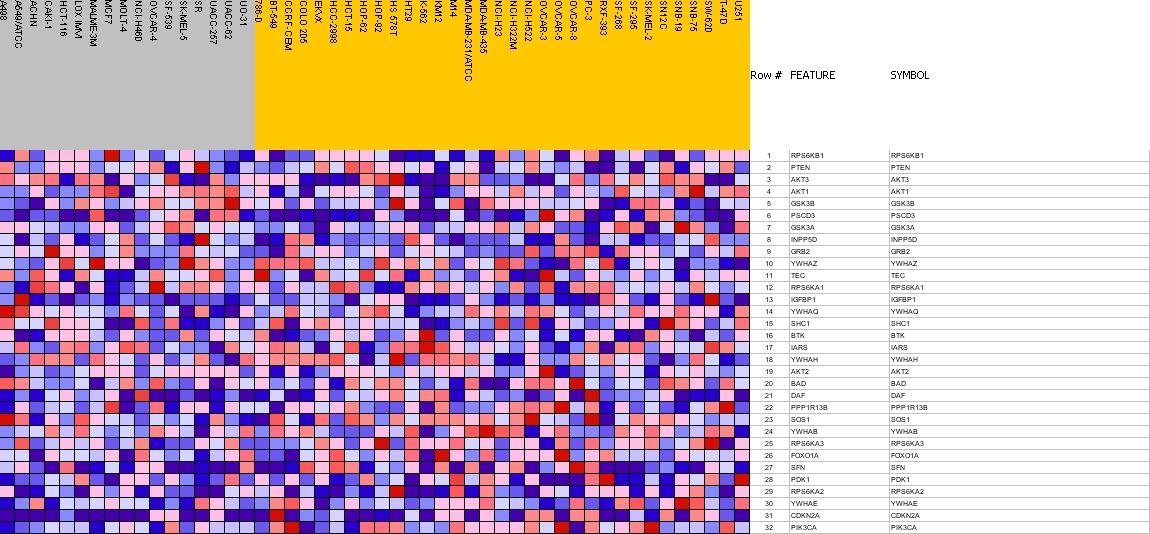
| PROBE | GENE SYMBOL | GENE_TITLE | RANK IN GENE LIST | RANK METRIC SCORE | RES | CORE_ENRICHMENT | |
|---|---|---|---|---|---|---|---|
| 1 | RPS6KB1 | RPS6KB1 StanfordSource, GeneCards | ribosomal protein S6 kinase, 70kDa, polypeptide 1 | 2460 | 0.148 | -0.2053 | No |
| 2 | PTEN | PTEN StanfordSource, GeneCards | phosphatase and tensin homolog (mutated in multiple advanced cancers 1) | 2740 | 0.133 | -0.1978 | No |
| 3 | AKT3 | AKT3 StanfordSource, GeneCards | v-akt murine thymoma viral oncogene homolog 3 (protein kinase B, gamma) | 2743 | 0.133 | -0.1629 | No |
| 4 | AKT1 | AKT1 StanfordSource, GeneCards | v-akt murine thymoma viral oncogene homolog 1 | 3184 | 0.112 | -0.1770 | No |
| 5 | GSK3B | GSK3B StanfordSource, GeneCards | glycogen synthase kinase 3 beta | 3246 | 0.109 | -0.1544 | No |
| 6 | PSCD3 | PSCD3 StanfordSource, GeneCards | pleckstrin homology, Sec7 and coiled-coil domains 3 | 3284 | 0.107 | -0.1298 | No |
| 7 | GSK3A | GSK3A StanfordSource, GeneCards | glycogen synthase kinase 3 alpha | 3725 | 0.087 | -0.1506 | No |
| 8 | INPP5D | INPP5D StanfordSource, GeneCards | inositol polyphosphate-5-phosphatase, 145kDa | 4090 | 0.070 | -0.1682 | No |
| 9 | GRB2 | GRB2 StanfordSource, GeneCards | growth factor receptor-bound protein 2 | 4102 | 0.070 | -0.1509 | No |
| 10 | YWHAZ | YWHAZ StanfordSource, GeneCards | tyrosine 3-monooxygenase/tryptophan 5-monooxygenase activation protein, zeta polypeptide | 4284 | 0.062 | -0.1526 | No |
| 11 | TEC | TEC StanfordSource, GeneCards | tec protein tyrosine kinase | 5015 | 0.030 | -0.2173 | No |
| 12 | RPS6KA1 | RPS6KA1 StanfordSource, GeneCards | ribosomal protein S6 kinase, 90kDa, polypeptide 1 | 5571 | 0.006 | -0.2708 | No |
| 13 | IGFBP1 | IGFBP1 StanfordSource, GeneCards | insulin-like growth factor binding protein 1 | 5678 | 0.002 | -0.2809 | No |
| 14 | YWHAQ | YWHAQ StanfordSource, GeneCards | tyrosine 3-monooxygenase/tryptophan 5-monooxygenase activation protein, theta polypeptide | 6353 | -0.030 | -0.3400 | No |
| 15 | SHC1 | SHC1 StanfordSource, GeneCards | SHC (Src homology 2 domain containing) transforming protein 1 | 6401 | -0.032 | -0.3363 | No |
| 16 | BTK | BTK StanfordSource, GeneCards | Bruton agammaglobulinemia tyrosine kinase | 6791 | -0.051 | -0.3616 | No |
| 17 | IARS | IARS StanfordSource, GeneCards | isoleucine-tRNA synthetase | 7132 | -0.068 | -0.3775 | No |
| 18 | YWHAH | YWHAH StanfordSource, GeneCards | tyrosine 3-monooxygenase/tryptophan 5-monooxygenase activation protein, eta polypeptide | 7202 | -0.071 | -0.3656 | No |
| 19 | AKT2 | AKT2 StanfordSource, GeneCards | v-akt murine thymoma viral oncogene homolog 2 | 7281 | -0.075 | -0.3535 | No |
| 20 | BAD | BAD StanfordSource, GeneCards | BCL2-antagonist of cell death | 7728 | -0.099 | -0.3716 | Yes |
| 21 | DAF | DAF StanfordSource, GeneCards | decay accelerating factor for complement (CD55, Cromer blood group system) | 7829 | -0.105 | -0.3538 | Yes |
| 22 | PPP1R13B | PPP1R13B StanfordSource, GeneCards | protein phosphatase 1, regulatory (inhibitor) subunit 13B | 7989 | -0.114 | -0.3397 | Yes |
| 23 | SOS1 | SOS1 StanfordSource, GeneCards | son of sevenless homolog 1 (Drosophila) | 8043 | -0.116 | -0.3143 | Yes |
| 24 | YWHAB | YWHAB StanfordSource, GeneCards | tyrosine 3-monooxygenase/tryptophan 5-monooxygenase activation protein, beta polypeptide | 8165 | -0.125 | -0.2934 | Yes |
| 25 | RPS6KA3 | RPS6KA3 StanfordSource, GeneCards | ribosomal protein S6 kinase, 90kDa, polypeptide 3 | 8418 | -0.143 | -0.2808 | Yes |
| 26 | FOXO1A | FOXO1A StanfordSource, GeneCards | forkhead box O1A (rhabdomyosarcoma) | 8617 | -0.157 | -0.2591 | Yes |
| 27 | SFN | SFN StanfordSource, GeneCards | stratifin | 9070 | -0.190 | -0.2540 | Yes |
| 28 | PDK1 | PDK1 StanfordSource, GeneCards | pyruvate dehydrogenase kinase, isoenzyme 1 | 9186 | -0.200 | -0.2129 | Yes |
| 29 | RPS6KA2 | RPS6KA2 StanfordSource, GeneCards | ribosomal protein S6 kinase, 90kDa, polypeptide 2 | 9391 | -0.220 | -0.1752 | Yes |
| 30 | YWHAE | YWHAE StanfordSource, GeneCards | tyrosine 3-monooxygenase/tryptophan 5-monooxygenase activation protein, epsilon polypeptide | 9542 | -0.241 | -0.1268 | Yes |
| 31 | CDKN2A | CDKN2A StanfordSource, GeneCards | cyclin-dependent kinase inhibitor 2A (melanoma, p16, inhibits CDK4) | 9931 | -0.324 | -0.0799 | Yes |
| 32 | PIK3CA | PIK3CA StanfordSource, GeneCards | phosphoinositide-3-kinase, catalytic, alpha polypeptide | 10023 | -0.366 | 0.0075 | Yes |