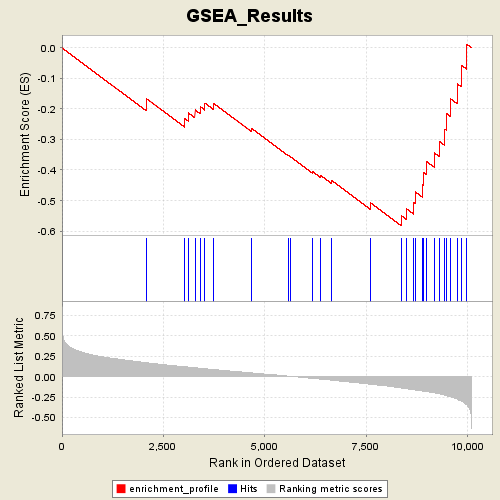
Profile of the Running ES Score & Positions of GeneSet Members on the Rank Ordered List
| Dataset | p53_full_useme_maxed_cs.gct |
| Phenotype | MUT |
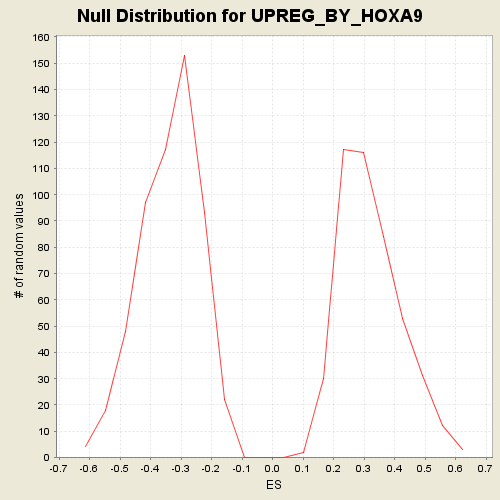
| GeneSet | s2.symbols.gmt#UPREG_BY_HOXA9 |
| Enrichment Score (ES) | -0.5831967 |
| Normalized Enrichment Score (NES) | -1.7311263 |
| Nominal p-value | 0.007246377 |
| FDR q-value | 0.36441836 |
| FWER p-Value | 0.582 |
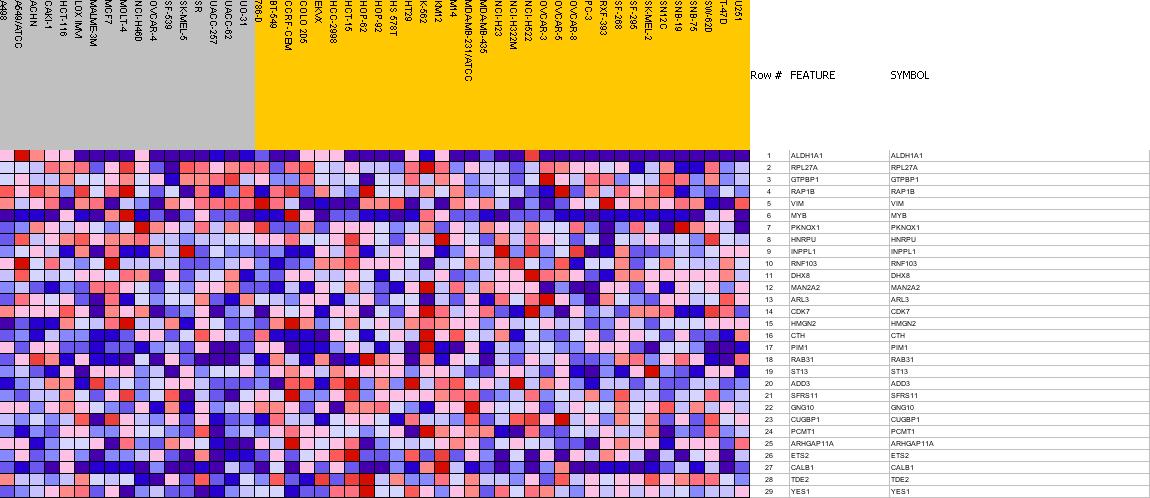
| PROBE | GENE SYMBOL | GENE_TITLE | RANK IN GENE LIST | RANK METRIC SCORE | RES | CORE_ENRICHMENT | |
|---|---|---|---|---|---|---|---|
| 1 | ALDH1A1 | ALDH1A1 StanfordSource, GeneCards | aldehyde dehydrogenase 1 family, member A1 | 2074 | 0.171 | -0.1654 | No |
| 2 | RPL27A | RPL27A StanfordSource, GeneCards | ribosomal protein L27a | 3027 | 0.120 | -0.2314 | No |
| 3 | GTPBP1 | GTPBP1 StanfordSource, GeneCards | GTP binding protein 1 | 3121 | 0.115 | -0.2133 | No |
| 4 | RAP1B | RAP1B StanfordSource, GeneCards | RAP1B, member of RAS oncogene family | 3280 | 0.108 | -0.2035 | No |
| 5 | VIM | VIM StanfordSource, GeneCards | vimentin | 3412 | 0.101 | -0.1925 | No |
| 6 | MYB | MYB StanfordSource, GeneCards | v-myb myeloblastosis viral oncogene homolog (avian) | 3526 | 0.096 | -0.1809 | No |
| 7 | PKNOX1 | PKNOX1 StanfordSource, GeneCards | PBX/knotted 1 homeobox 1 | 3741 | 0.086 | -0.1818 | No |
| 8 | HNRPU | HNRPU StanfordSource, GeneCards | heterogeneous nuclear ribonucleoprotein U (scaffold attachment factor A) | 4671 | 0.045 | -0.2633 | No |
| 9 | INPPL1 | INPPL1 StanfordSource, GeneCards | inositol polyphosphate phosphatase-like 1 | 5586 | 0.006 | -0.3527 | No |
| 10 | RNF103 | RNF103 StanfordSource, GeneCards | ring finger protein 103 | 5626 | 0.004 | -0.3557 | No |
| 11 | DHX8 | DHX8 StanfordSource, GeneCards | DEAH (Asp-Glu-Ala-His) box polypeptide 8 | 6186 | -0.022 | -0.4059 | No |
| 12 | MAN2A2 | MAN2A2 StanfordSource, GeneCards | mannosidase, alpha, class 2A, member 2 | 6377 | -0.031 | -0.4174 | No |
| 13 | ARL3 | ARL3 StanfordSource, GeneCards | ADP-ribosylation factor-like 3 | 6644 | -0.043 | -0.4337 | No |
| 14 | CDK7 | CDK7 StanfordSource, GeneCards | cyclin-dependent kinase 7 (MO15 homolog, Xenopus laevis, cdk-activating kinase) | 7615 | -0.093 | -0.5079 | No |
| 15 | HMGN2 | HMGN2 StanfordSource, GeneCards | high-mobility group nucleosomal binding domain 2 | 8374 | -0.140 | -0.5501 | Yes |
| 16 | CTH | CTH StanfordSource, GeneCards | cystathionase (cystathionine gamma-lyase) | 8496 | -0.148 | -0.5270 | Yes |
| 17 | PIM1 | PIM1 StanfordSource, GeneCards | pim-1 oncogene | 8673 | -0.161 | -0.5064 | Yes |
| 18 | RAB31 | RAB31 StanfordSource, GeneCards | RAB31, member RAS oncogene family | 8714 | -0.163 | -0.4718 | Yes |
| 19 | ST13 | ST13 StanfordSource, GeneCards | suppression of tumorigenicity 13 (colon carcinoma) (Hsp70 interacting protein) | 8895 | -0.175 | -0.4481 | Yes |
| 20 | ADD3 | ADD3 StanfordSource, GeneCards | adducin 3 (gamma) | 8916 | -0.177 | -0.4081 | Yes |
| 21 | SFRS11 | SFRS11 StanfordSource, GeneCards | splicing factor, arginine/serine-rich 11 | 8981 | -0.183 | -0.3711 | Yes |
| 22 | GNG10 | GNG10 StanfordSource, GeneCards | guanine nucleotide binding protein (G protein), gamma 10 | 9182 | -0.199 | -0.3438 | Yes |
| 23 | CUGBP1 | CUGBP1 StanfordSource, GeneCards | CUG triplet repeat, RNA binding protein 1 | 9301 | -0.210 | -0.3058 | Yes |
| 24 | PCMT1 | PCMT1 StanfordSource, GeneCards | protein-L-isoaspartate (D-aspartate) O-methyltransferase | 9439 | -0.226 | -0.2659 | Yes |
| 25 | ARHGAP11A | ARHGAP11A StanfordSource, GeneCards | KIAA0013 gene product | 9482 | -0.232 | -0.2151 | Yes |
| 26 | ETS2 | ETS2 StanfordSource, GeneCards | v-ets erythroblastosis virus E26 oncogene homolog 2 (avian) | 9581 | -0.247 | -0.1665 | Yes |
| 27 | CALB1 | CALB1 StanfordSource, GeneCards | calbindin 1, 28kDa | 9742 | -0.274 | -0.1174 | Yes |
| 28 | TDE2 | TDE2 StanfordSource, GeneCards | tumor differentially expressed 2 | 9850 | -0.299 | -0.0571 | Yes |
| 29 | YES1 | YES1 StanfordSource, GeneCards | v-yes-1 Yamaguchi sarcoma viral oncogene homolog 1 | 9982 | -0.345 | 0.0116 | Yes |