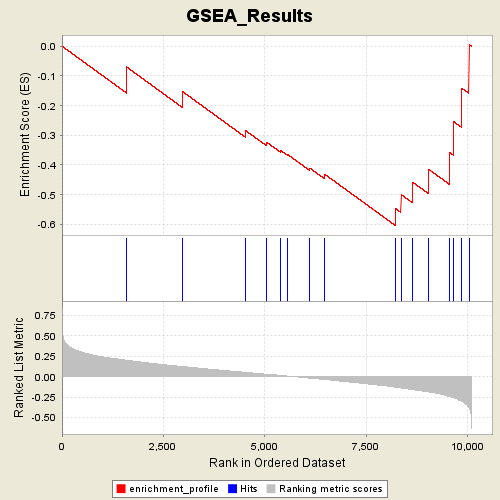
Profile of the Running ES Score & Positions of GeneSet Members on the Rank Ordered List
| Dataset | p53_full_useme_maxed_cs.gct |
| Phenotype | MUT |
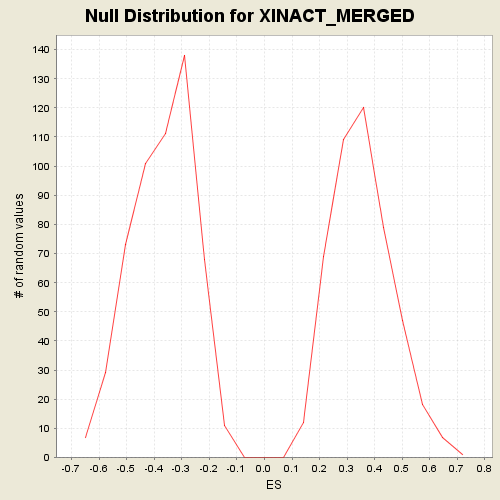
| GeneSet | s2.symbols.gmt#XINACT_MERGED |
| Enrichment Score (ES) | -0.60528135 |
| Normalized Enrichment Score (NES) | -1.6415856 |
| Nominal p-value | 0.014869888 |
| FDR q-value | 0.4496216 |
| FWER p-Value | 0.8 |
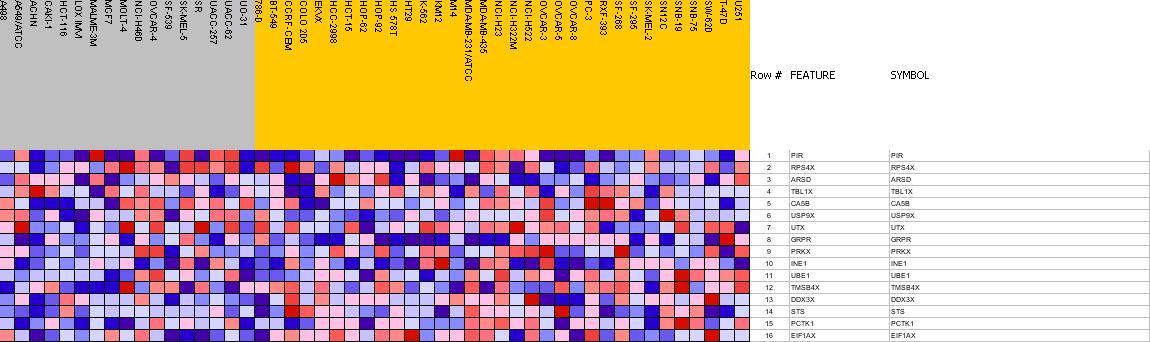
| PROBE | GENE SYMBOL | GENE_TITLE | RANK IN GENE LIST | RANK METRIC SCORE | RES | CORE_ENRICHMENT | |
|---|---|---|---|---|---|---|---|
| 1 | PIR | PIR StanfordSource, GeneCards | Pirin | 1594 | 0.200 | -0.0703 | No |
| 2 | RPS4X | RPS4X StanfordSource, GeneCards | ribosomal protein S4, X-linked | 2974 | 0.123 | -0.1531 | No |
| 3 | ARSD | ARSD StanfordSource, GeneCards | arylsulfatase D | 4523 | 0.052 | -0.2837 | No |
| 4 | TBL1X | TBL1X StanfordSource, GeneCards | transducin (beta)-like 1X-linked | 5052 | 0.028 | -0.3237 | No |
| 5 | CA5B | CA5B StanfordSource, GeneCards | carbonic anhydrase VB, mitochondrial | 5391 | 0.015 | -0.3508 | No |
| 6 | USP9X | USP9X StanfordSource, GeneCards | ubiquitin specific protease 9, X-linked (fat facets-like, Drosophila) | 5551 | 0.007 | -0.3634 | No |
| 7 | UTX | UTX StanfordSource, GeneCards | ubiquitously transcribed tetratricopeptide repeat gene, X chromosome | 6113 | -0.019 | -0.4106 | No |
| 8 | GRPR | GRPR StanfordSource, GeneCards | gastrin-releasing peptide receptor | 6477 | -0.036 | -0.4309 | No |
| 9 | PRKX | PRKX StanfordSource, GeneCards | protein kinase, X-linked | 8236 | -0.130 | -0.5481 | Yes |
| 10 | INE1 | INE1 StanfordSource, GeneCards | inactivation escape 1 | 8360 | -0.139 | -0.4993 | Yes |
| 11 | UBE1 | UBE1 StanfordSource, GeneCards | ubiquitin-activating enzyme E1 (A1S9T and BN75 temperature sensitivity complementing) | 8643 | -0.159 | -0.4575 | Yes |
| 12 | TMSB4X | TMSB4X StanfordSource, GeneCards | thymosin, beta 4, X-linked | 9032 | -0.187 | -0.4136 | Yes |
| 13 | DDX3X | DDX3X StanfordSource, GeneCards | DEAD (Asp-Glu-Ala-Asp) box polypeptide 3, X-linked | 9568 | -0.245 | -0.3590 | Yes |
| 14 | STS | STS StanfordSource, GeneCards | steroid sulfatase (microsomal), arylsulfatase C, isozyme S | 9663 | -0.258 | -0.2547 | Yes |
| 15 | PCTK1 | PCTK1 StanfordSource, GeneCards | PCTAIRE protein kinase 1 | 9855 | -0.301 | -0.1412 | Yes |
| 16 | EIF1AX | EIF1AX StanfordSource, GeneCards | eukaryotic translation initiation factor 1A, X-linked | 10037 | -0.376 | 0.0061 | Yes |