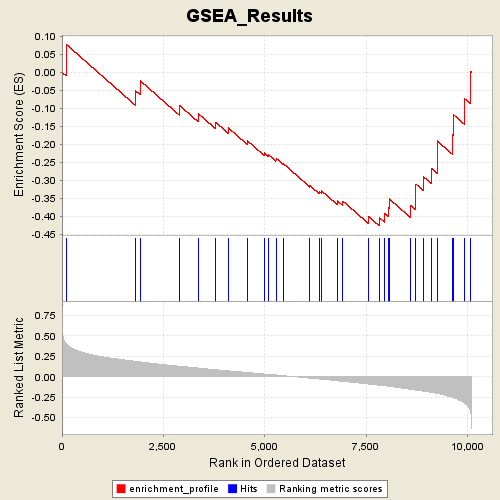
Profile of the Running ES Score & Positions of GeneSet Members on the Rank Ordered List
| Dataset | p53_full_useme_maxed_cs.gct |
| Phenotype | MUT |
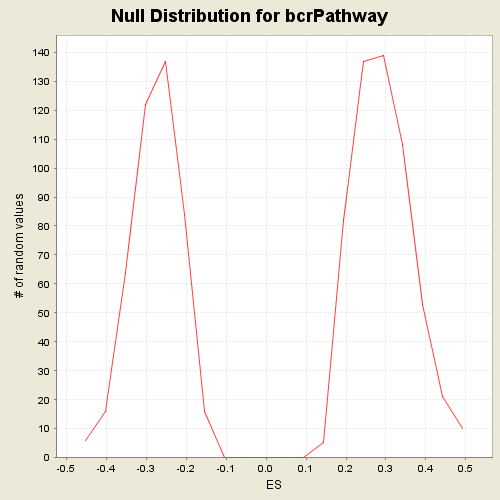
| GeneSet | s2.symbols.gmt#bcrPathway |
| Enrichment Score (ES) | -0.42674714 |
| Normalized Enrichment Score (NES) | -1.5497769 |
| Nominal p-value | 0.013483146 |
| FDR q-value | 0.49218473 |
| FWER p-Value | 0.931 |
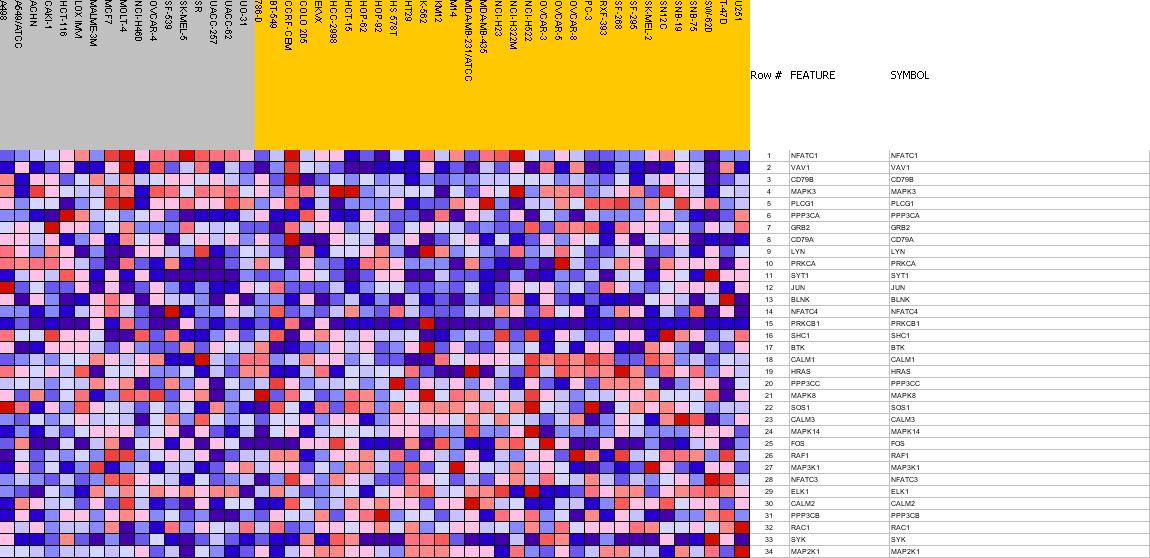
| PROBE | GENE SYMBOL | GENE_TITLE | RANK IN GENE LIST | RANK METRIC SCORE | RES | CORE_ENRICHMENT | |
|---|---|---|---|---|---|---|---|
| 1 | NFATC1 | NFATC1 StanfordSource, GeneCards | nuclear factor of activated T-cells, cytoplasmic, calcineurin-dependent 1 | 103 | 0.400 | 0.0778 | No |
| 2 | VAV1 | VAV1 StanfordSource, GeneCards | vav 1 oncogene | 1817 | 0.185 | -0.0516 | No |
| 3 | CD79B | CD79B StanfordSource, GeneCards | CD79B antigen (immunoglobulin-associated beta) | 1931 | 0.179 | -0.0235 | No |
| 4 | MAPK3 | MAPK3 StanfordSource, GeneCards | mitogen-activated protein kinase 3 | 2905 | 0.125 | -0.0926 | No |
| 5 | PLCG1 | PLCG1 StanfordSource, GeneCards | phospholipase C, gamma 1 (formerly subtype 148) | 3357 | 0.105 | -0.1144 | No |
| 6 | PPP3CA | PPP3CA StanfordSource, GeneCards | protein phosphatase 3 (formerly 2B), catalytic subunit, alpha isoform (calcineurin A alpha) | 3791 | 0.084 | -0.1389 | No |
| 7 | GRB2 | GRB2 StanfordSource, GeneCards | growth factor receptor-bound protein 2 | 4102 | 0.070 | -0.1544 | No |
| 8 | CD79A | CD79A StanfordSource, GeneCards | CD79A antigen (immunoglobulin-associated alpha) | 4575 | 0.050 | -0.1904 | No |
| 9 | LYN | LYN StanfordSource, GeneCards | v-yes-1 Yamaguchi sarcoma viral related oncogene homolog | 4984 | 0.031 | -0.2241 | No |
| 10 | PRKCA | PRKCA StanfordSource, GeneCards | protein kinase C, alpha | 5086 | 0.027 | -0.2282 | No |
| 11 | SYT1 | SYT1 StanfordSource, GeneCards | synaptotagmin I | 5278 | 0.020 | -0.2428 | No |
| 12 | JUN | JUN StanfordSource, GeneCards | v-jun sarcoma virus 17 oncogene homolog (avian) | 5283 | 0.019 | -0.2390 | No |
| 13 | BLNK | BLNK StanfordSource, GeneCards | B-cell linker | 5456 | 0.012 | -0.2535 | No |
| 14 | NFATC4 | NFATC4 StanfordSource, GeneCards | nuclear factor of activated T-cells, cytoplasmic, calcineurin-dependent 4 | 6114 | -0.019 | -0.3145 | No |
| 15 | PRKCB1 | PRKCB1 StanfordSource, GeneCards | protein kinase C, beta 1 | 6340 | -0.029 | -0.3305 | No |
| 16 | SHC1 | SHC1 StanfordSource, GeneCards | SHC (Src homology 2 domain containing) transforming protein 1 | 6401 | -0.032 | -0.3294 | No |
| 17 | BTK | BTK StanfordSource, GeneCards | Bruton agammaglobulinemia tyrosine kinase | 6791 | -0.051 | -0.3569 | No |
| 18 | CALM1 | CALM1 StanfordSource, GeneCards | calmodulin 1 (phosphorylase kinase, delta) | 6929 | -0.058 | -0.3578 | No |
| 19 | HRAS | HRAS StanfordSource, GeneCards | v-Ha-ras Harvey rat sarcoma viral oncogene homolog | 7563 | -0.090 | -0.4008 | No |
| 20 | PPP3CC | PPP3CC StanfordSource, GeneCards | protein phosphatase 3 (formerly 2B), catalytic subunit, gamma isoform (calcineurin A gamma) | 7825 | -0.105 | -0.4036 | Yes |
| 21 | MAPK8 | MAPK8 StanfordSource, GeneCards | mitogen-activated protein kinase 8 | 7956 | -0.112 | -0.3919 | Yes |
| 22 | SOS1 | SOS1 StanfordSource, GeneCards | son of sevenless homolog 1 (Drosophila) | 8043 | -0.116 | -0.3749 | Yes |
| 23 | CALM3 | CALM3 StanfordSource, GeneCards | calmodulin 3 (phosphorylase kinase, delta) | 8068 | -0.118 | -0.3513 | Yes |
| 24 | MAPK14 | MAPK14 StanfordSource, GeneCards | mitogen-activated protein kinase 14 | 8605 | -0.156 | -0.3703 | Yes |
| 25 | FOS | FOS StanfordSource, GeneCards | v-fos FBJ murine osteosarcoma viral oncogene homolog | 8716 | -0.163 | -0.3454 | Yes |
| 26 | RAF1 | RAF1 StanfordSource, GeneCards | v-raf-1 murine leukemia viral oncogene homolog 1 | 8728 | -0.164 | -0.3104 | Yes |
| 27 | MAP3K1 | MAP3K1 StanfordSource, GeneCards | mitogen-activated protein kinase kinase kinase 1 | 8906 | -0.177 | -0.2891 | Yes |
| 28 | NFATC3 | NFATC3 StanfordSource, GeneCards | nuclear factor of activated T-cells, cytoplasmic, calcineurin-dependent 3 | 9112 | -0.193 | -0.2670 | Yes |
| 29 | ELK1 | ELK1 StanfordSource, GeneCards | ELK1, member of ETS oncogene family | 9250 | -0.205 | -0.2355 | Yes |
| 30 | CALM2 | CALM2 StanfordSource, GeneCards | calmodulin 2 (phosphorylase kinase, delta) | 9251 | -0.205 | -0.1904 | Yes |
| 31 | PPP3CB | PPP3CB StanfordSource, GeneCards | protein phosphatase 3 (formerly 2B), catalytic subunit, beta isoform (calcineurin A beta) | 9639 | -0.254 | -0.1730 | Yes |
| 32 | RAC1 | RAC1 StanfordSource, GeneCards | ras-related C3 botulinum toxin substrate 1 (rho family, small GTP binding protein Rac1) | 9657 | -0.258 | -0.1180 | Yes |
| 33 | SYK | SYK StanfordSource, GeneCards | spleen tyrosine kinase | 9936 | -0.325 | -0.0740 | Yes |
| 34 | MAP2K1 | MAP2K1 StanfordSource, GeneCards | mitogen-activated protein kinase kinase 1 | 10067 | -0.410 | 0.0032 | Yes |