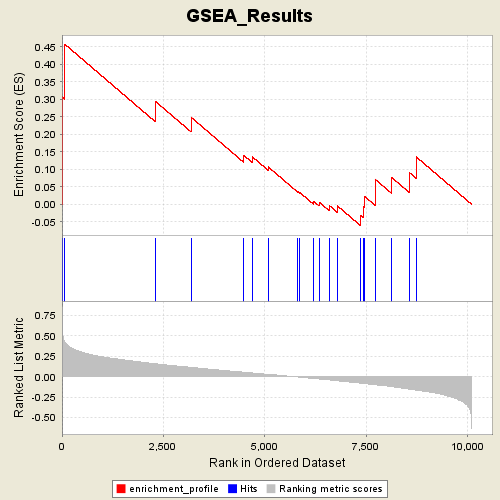
Profile of the Running ES Score & Positions of GeneSet Members on the Rank Ordered List
| Dataset | p53_full_useme_maxed_cs.gct |
| Phenotype | WT |
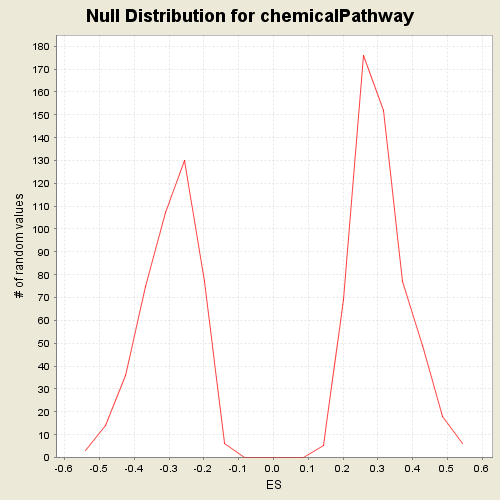
| GeneSet | s2.symbols.gmt#chemicalPathway |
| Enrichment Score (ES) | 0.45646906 |
| Normalized Enrichment Score (NES) | 1.48676 |
| Nominal p-value | 0.045289855 |
| FDR q-value | 0.69150734 |
| FWER p-Value | 0.989 |
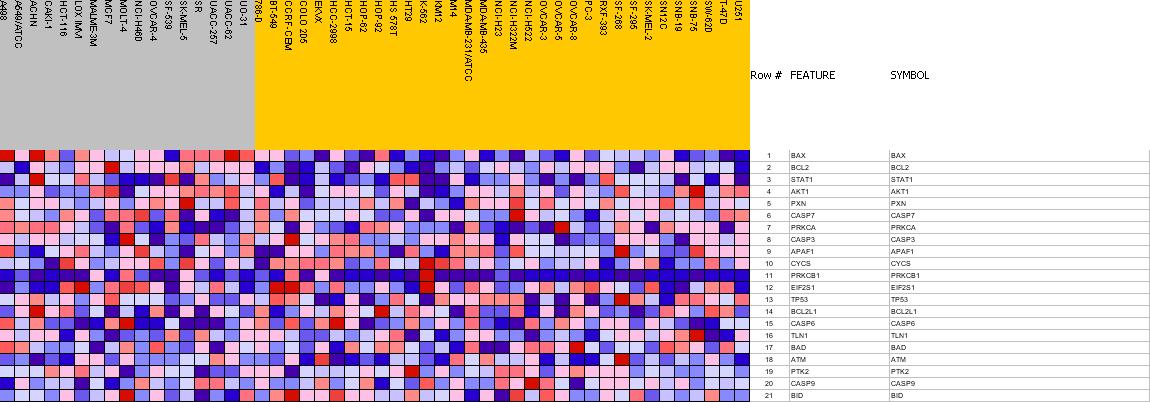
| PROBE | GENE SYMBOL | GENE_TITLE | RANK IN GENE LIST | RANK METRIC SCORE | RES | CORE_ENRICHMENT | |
|---|---|---|---|---|---|---|---|
| 1 | BAX | BAX StanfordSource, GeneCards | BCL2-associated X protein | 1 | 0.823 | 0.3068 | Yes |
| 2 | BCL2 | BCL2 StanfordSource, GeneCards | B-cell CLL/lymphoma 2 | 71 | 0.420 | 0.4565 | Yes |
| 3 | STAT1 | STAT1 StanfordSource, GeneCards | signal transducer and activator of transcription 1, 91kDa | 2296 | 0.157 | 0.2944 | No |
| 4 | AKT1 | AKT1 StanfordSource, GeneCards | v-akt murine thymoma viral oncogene homolog 1 | 3184 | 0.112 | 0.2483 | No |
| 5 | PXN | PXN StanfordSource, GeneCards | paxillin | 4475 | 0.054 | 0.1404 | No |
| 6 | CASP7 | CASP7 StanfordSource, GeneCards | caspase 7, apoptosis-related cysteine protease | 4696 | 0.044 | 0.1351 | No |
| 7 | PRKCA | PRKCA StanfordSource, GeneCards | protein kinase C, alpha | 5086 | 0.027 | 0.1065 | No |
| 8 | CASP3 | CASP3 StanfordSource, GeneCards | caspase 3, apoptosis-related cysteine protease | 5813 | -0.004 | 0.0361 | No |
| 9 | APAF1 | APAF1 StanfordSource, GeneCards | apoptotic protease activating factor | 5864 | -0.007 | 0.0337 | No |
| 10 | CYCS | CYCS StanfordSource, GeneCards | cytochrome c, somatic | 6206 | -0.023 | 0.0085 | No |
| 11 | PRKCB1 | PRKCB1 StanfordSource, GeneCards | protein kinase C, beta 1 | 6340 | -0.029 | 0.0062 | No |
| 12 | EIF2S1 | EIF2S1 StanfordSource, GeneCards | eukaryotic translation initiation factor 2, subunit 1 alpha, 35kDa | 6596 | -0.041 | -0.0039 | No |
| 13 | TP53 | TP53 StanfordSource, GeneCards | tumor protein p53 (Li-Fraumeni syndrome) | 6783 | -0.050 | -0.0037 | No |
| 14 | BCL2L1 | BCL2L1 StanfordSource, GeneCards | BCL2-like 1 | 7371 | -0.080 | -0.0320 | No |
| 15 | CASP6 | CASP6 StanfordSource, GeneCards | caspase 6, apoptosis-related cysteine protease | 7432 | -0.084 | -0.0067 | No |
| 16 | TLN1 | TLN1 StanfordSource, GeneCards | talin 1 | 7472 | -0.086 | 0.0215 | No |
| 17 | BAD | BAD StanfordSource, GeneCards | BCL2-antagonist of cell death | 7728 | -0.099 | 0.0333 | No |
| 18 | ATM | ATM StanfordSource, GeneCards | ataxia telangiectasia mutated (includes complementation groups A, C and D) | 7735 | -0.100 | 0.0700 | No |
| 19 | PTK2 | PTK2 StanfordSource, GeneCards | PTK2 protein tyrosine kinase 2 | 8134 | -0.122 | 0.0761 | No |
| 20 | CASP9 | CASP9 StanfordSource, GeneCards | caspase 9, apoptosis-related cysteine protease | 8578 | -0.154 | 0.0894 | No |
| 21 | BID | BID StanfordSource, GeneCards | BH3 interacting domain death agonist | 8740 | -0.165 | 0.1348 | No |