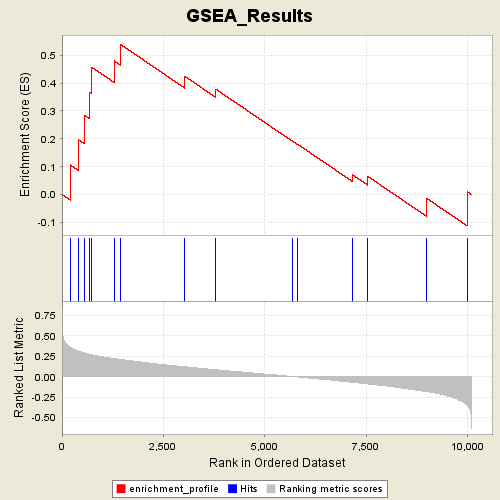
Profile of the Running ES Score & Positions of GeneSet Members on the Rank Ordered List
| Dataset | p53_full_useme_maxed_cs.gct |
| Phenotype | WT |
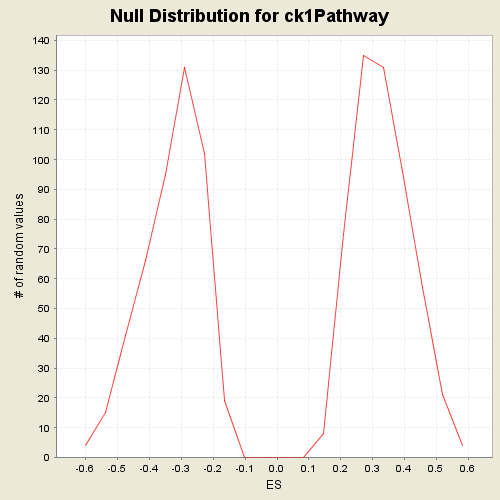
| GeneSet | s2.symbols.gmt#ck1Pathway |
| Enrichment Score (ES) | 0.53940195 |
| Normalized Enrichment Score (NES) | 1.6332773 |
| Nominal p-value | 0.0151802655 |
| FDR q-value | 0.4493492 |
| FWER p-Value | 0.835 |
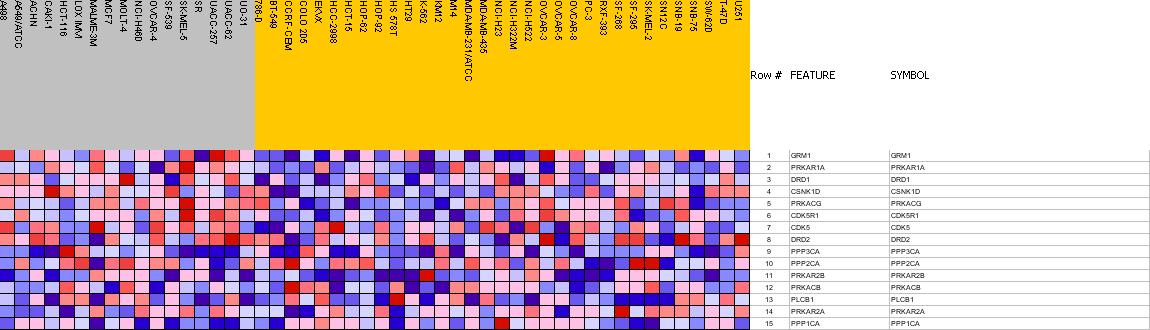
| PROBE | GENE SYMBOL | GENE_TITLE | RANK IN GENE LIST | RANK METRIC SCORE | RES | CORE_ENRICHMENT | |
|---|---|---|---|---|---|---|---|
| 1 | GRM1 | GRM1 StanfordSource, GeneCards | glutamate receptor, metabotropic 1 | 202 | 0.357 | 0.1059 | Yes |
| 2 | PRKAR1A | PRKAR1A StanfordSource, GeneCards | protein kinase, cAMP-dependent, regulatory, type I, alpha (tissue specific extinguisher 1) | 397 | 0.315 | 0.1977 | Yes |
| 3 | DRD1 | DRD1 StanfordSource, GeneCards | dopamine receptor D1 | 553 | 0.290 | 0.2845 | Yes |
| 4 | CSNK1D | CSNK1D StanfordSource, GeneCards | casein kinase 1, delta | 690 | 0.272 | 0.3669 | Yes |
| 5 | PRKACG | PRKACG StanfordSource, GeneCards | protein kinase, cAMP-dependent, catalytic, gamma | 727 | 0.267 | 0.4576 | Yes |
| 6 | CDK5R1 | CDK5R1 StanfordSource, GeneCards | cyclin-dependent kinase 5, regulatory subunit 1 (p35) | 1288 | 0.221 | 0.4799 | Yes |
| 7 | CDK5 | CDK5 StanfordSource, GeneCards | cyclin-dependent kinase 5 | 1440 | 0.211 | 0.5394 | Yes |
| 8 | DRD2 | DRD2 StanfordSource, GeneCards | dopamine receptor D2 | 3029 | 0.120 | 0.4244 | No |
| 9 | PPP3CA | PPP3CA StanfordSource, GeneCards | protein phosphatase 3 (formerly 2B), catalytic subunit, alpha isoform (calcineurin A alpha) | 3791 | 0.084 | 0.3786 | No |
| 10 | PPP2CA | PPP2CA StanfordSource, GeneCards | protein phosphatase 2 (formerly 2A), catalytic subunit, alpha isoform | 5685 | 0.001 | 0.1913 | No |
| 11 | PRKAR2B | PRKAR2B StanfordSource, GeneCards | protein kinase, cAMP-dependent, regulatory, type II, beta | 5806 | -0.004 | 0.1809 | No |
| 12 | PRKACB | PRKACB StanfordSource, GeneCards | protein kinase, cAMP-dependent, catalytic, beta | 7159 | -0.069 | 0.0711 | No |
| 13 | PLCB1 | PLCB1 StanfordSource, GeneCards | phospholipase C, beta 1 (phosphoinositide-specific) | 7545 | -0.090 | 0.0646 | No |
| 14 | PRKAR2A | PRKAR2A StanfordSource, GeneCards | protein kinase, cAMP-dependent, regulatory, type II, alpha | 8998 | -0.184 | -0.0143 | No |
| 15 | PPP1CA | PPP1CA StanfordSource, GeneCards | protein phosphatase 1, catalytic subunit, alpha isoform | 9995 | -0.350 | 0.0103 | No |