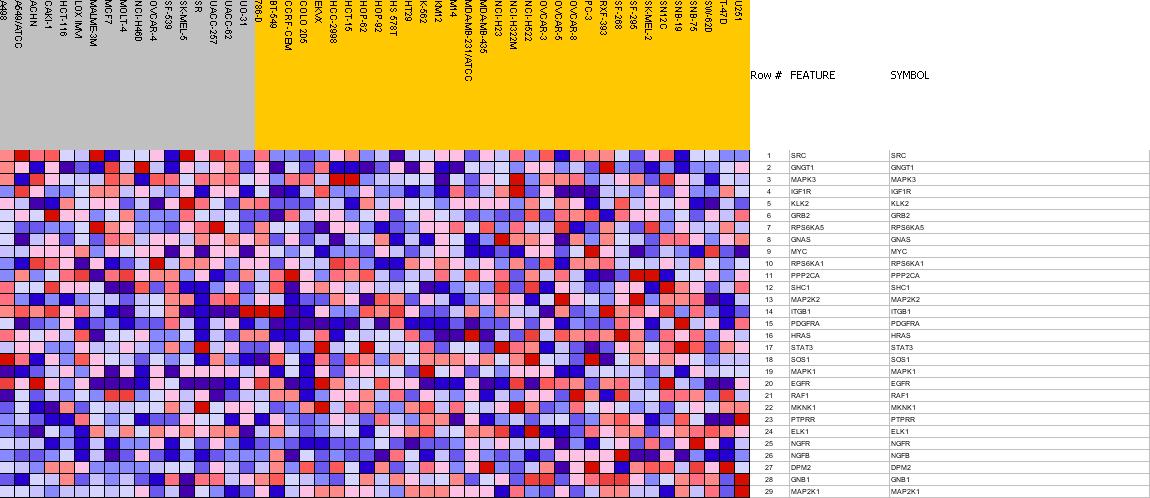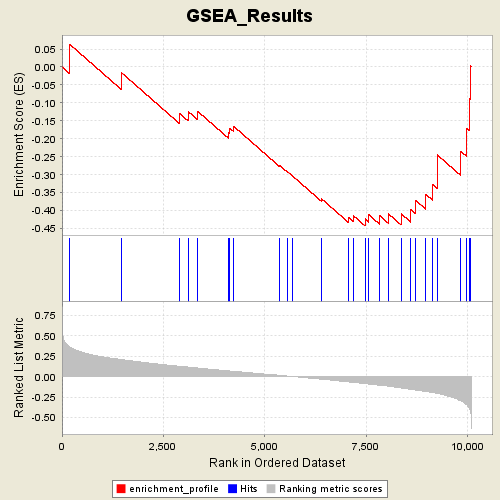
Profile of the Running ES Score & Positions of GeneSet Members on the Rank Ordered List
| Dataset | p53_full_useme_maxed_cs.gct |
| Phenotype | MUT |
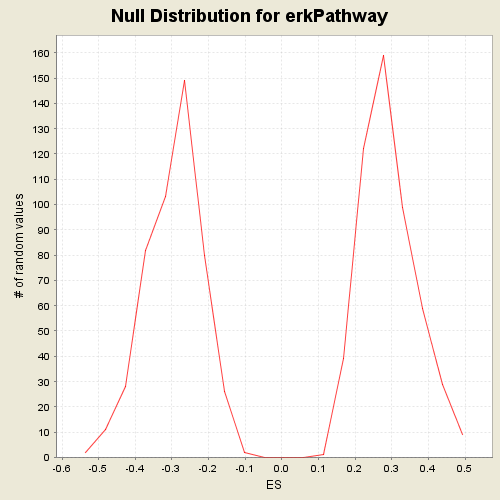
| GeneSet | s2.symbols.gmt#erkPathway |
| Enrichment Score (ES) | -0.44335988 |
| Normalized Enrichment Score (NES) | -1.4973041 |
| Nominal p-value | 0.033126295 |
| FDR q-value | 0.52282375 |
| FWER p-Value | 0.97 |
| PROBE | GENE SYMBOL | GENE_TITLE | RANK IN GENE LIST | RANK METRIC SCORE | RES | CORE_ENRICHMENT | |
|---|---|---|---|---|---|---|---|
| 1 | SRC | SRC StanfordSource, GeneCards | v-src sarcoma (Schmidt-Ruppin A-2) viral oncogene homolog (avian) | 191 | 0.362 | 0.0632 | No |
| 2 | GNGT1 | GNGT1 StanfordSource, GeneCards | guanine nucleotide binding protein (G protein), gamma transducing activity polypeptide 1 | 1466 | 0.209 | -0.0158 | No |
| 3 | MAPK3 | MAPK3 StanfordSource, GeneCards | mitogen-activated protein kinase 3 | 2905 | 0.125 | -0.1301 | No |
| 4 | IGF1R | IGF1R StanfordSource, GeneCards | insulin-like growth factor 1 receptor | 3110 | 0.116 | -0.1240 | No |
| 5 | KLK2 | KLK2 StanfordSource, GeneCards | kallikrein 2, prostatic | 3351 | 0.105 | -0.1240 | No |
| 6 | GRB2 | GRB2 StanfordSource, GeneCards | growth factor receptor-bound protein 2 | 4102 | 0.070 | -0.1826 | No |
| 7 | RPS6KA5 | RPS6KA5 StanfordSource, GeneCards | ribosomal protein S6 kinase, 90kDa, polypeptide 5 | 4135 | 0.068 | -0.1703 | No |
| 8 | GNAS | GNAS StanfordSource, GeneCards | GNAS complex locus | 4227 | 0.064 | -0.1648 | No |
| 9 | MYC | MYC StanfordSource, GeneCards | v-myc myelocytomatosis viral oncogene homolog (avian) | 5372 | 0.015 | -0.2749 | No |
| 10 | RPS6KA1 | RPS6KA1 StanfordSource, GeneCards | ribosomal protein S6 kinase, 90kDa, polypeptide 1 | 5571 | 0.006 | -0.2931 | No |
| 11 | PPP2CA | PPP2CA StanfordSource, GeneCards | protein phosphatase 2 (formerly 2A), catalytic subunit, alpha isoform | 5685 | 0.001 | -0.3040 | No |
| 12 | SHC1 | SHC1 StanfordSource, GeneCards | SHC (Src homology 2 domain containing) transforming protein 1 | 6401 | -0.032 | -0.3677 | No |
| 13 | MAP2K2 | MAP2K2 StanfordSource, GeneCards | mitogen-activated protein kinase kinase 2 | 7065 | -0.065 | -0.4189 | No |
| 14 | ITGB1 | ITGB1 StanfordSource, GeneCards | integrin, beta 1 (fibronectin receptor, beta polypeptide, antigen CD29 includes MDF2, MSK12) | 7190 | -0.071 | -0.4152 | No |
| 15 | PDGFRA | PDGFRA StanfordSource, GeneCards | platelet-derived growth factor receptor, alpha polypeptide | 7475 | -0.086 | -0.4238 | Yes |
| 16 | HRAS | HRAS StanfordSource, GeneCards | v-Ha-ras Harvey rat sarcoma viral oncogene homolog | 7563 | -0.090 | -0.4118 | Yes |
| 17 | STAT3 | STAT3 StanfordSource, GeneCards | signal transducer and activator of transcription 3 (acute-phase response factor) | 7827 | -0.105 | -0.4140 | Yes |
| 18 | SOS1 | SOS1 StanfordSource, GeneCards | son of sevenless homolog 1 (Drosophila) | 8043 | -0.116 | -0.4089 | Yes |
| 19 | MAPK1 | MAPK1 StanfordSource, GeneCards | mitogen-activated protein kinase 1 | 8361 | -0.139 | -0.4089 | Yes |
| 20 | EGFR | EGFR StanfordSource, GeneCards | epidermal growth factor receptor (erythroblastic leukemia viral (v-erb-b) oncogene homolog, avian) | 8599 | -0.156 | -0.3970 | Yes |
| 21 | RAF1 | RAF1 StanfordSource, GeneCards | v-raf-1 murine leukemia viral oncogene homolog 1 | 8728 | -0.164 | -0.3725 | Yes |
| 22 | MKNK1 | MKNK1 StanfordSource, GeneCards | MAP kinase-interacting serine/threonine kinase 1 | 8975 | -0.183 | -0.3554 | Yes |
| 23 | PTPRR | PTPRR StanfordSource, GeneCards | protein tyrosine phosphatase, receptor type, R | 9138 | -0.196 | -0.3270 | Yes |
| 24 | ELK1 | ELK1 StanfordSource, GeneCards | ELK1, member of ETS oncogene family | 9250 | -0.205 | -0.2914 | Yes |
| 25 | NGFR | NGFR StanfordSource, GeneCards | nerve growth factor receptor (TNFR superfamily, member 16) | 9255 | -0.205 | -0.2452 | Yes |
| 26 | NGFB | NGFB StanfordSource, GeneCards | nerve growth factor, beta polypeptide | 9835 | -0.297 | -0.2351 | Yes |
| 27 | DPM2 | DPM2 StanfordSource, GeneCards | dolichyl-phosphate mannosyltransferase polypeptide 2, regulatory subunit | 9984 | -0.346 | -0.1712 | Yes |
| 28 | GNB1 | GNB1 StanfordSource, GeneCards | guanine nucleotide binding protein (G protein), beta polypeptide 1 | 10054 | -0.393 | -0.0888 | Yes |
| 29 | MAP2K1 | MAP2K1 StanfordSource, GeneCards | mitogen-activated protein kinase kinase 1 | 10067 | -0.410 | 0.0032 | Yes |