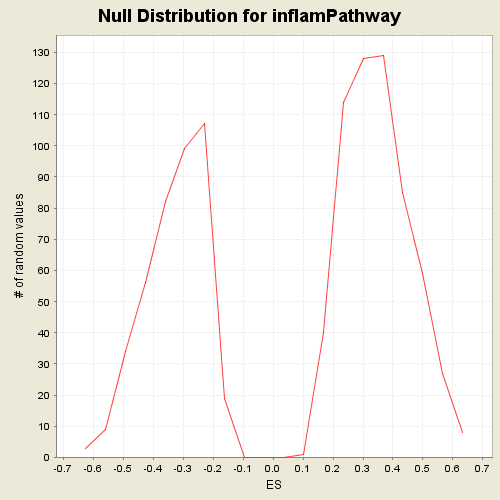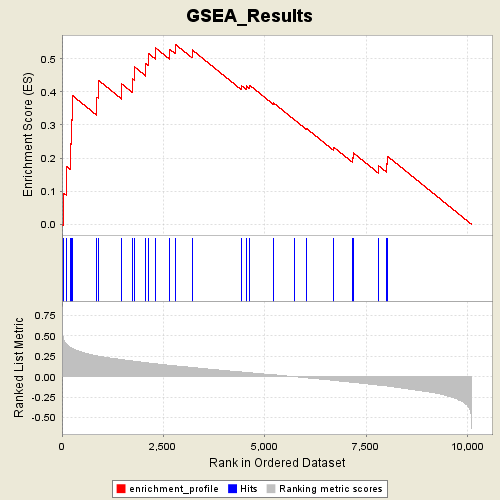
Profile of the Running ES Score & Positions of GeneSet Members on the Rank Ordered List
| Dataset | p53_full_useme_maxed_cs.gct |
| Phenotype | WT |
| GeneSet | s2.symbols.gmt#inflamPathway |
| Enrichment Score (ES) | 0.54343283 |
| Normalized Enrichment Score (NES) | 1.5540237 |
| Nominal p-value | 0.049069375 |
| FDR q-value | 0.7013238 |
| FWER p-Value | 0.955 |
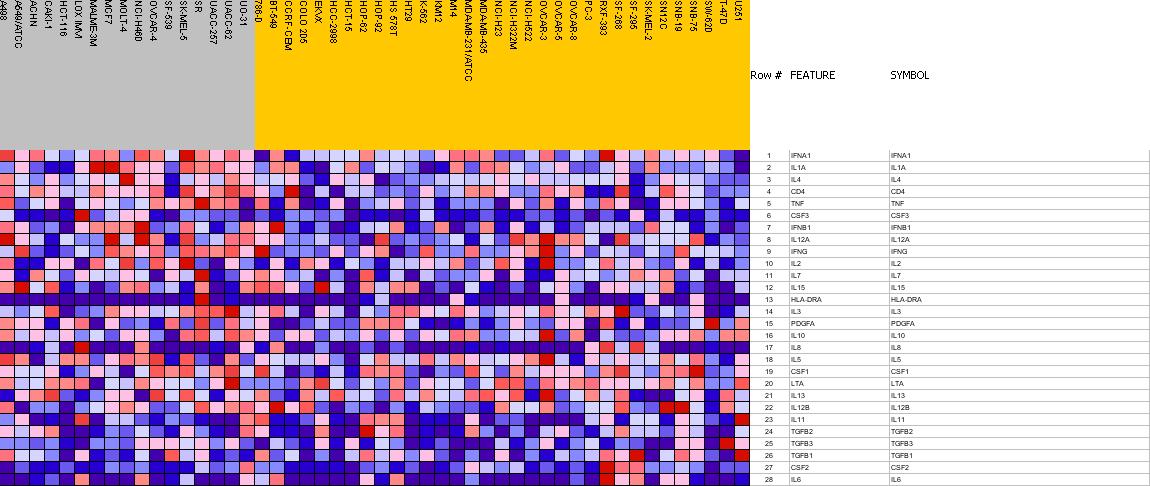
| PROBE | GENE SYMBOL | GENE_TITLE | RANK IN GENE LIST | RANK METRIC SCORE | RES | CORE_ENRICHMENT | |
|---|---|---|---|---|---|---|---|
| 1 | IFNA1 | IFNA1 StanfordSource, GeneCards | interferon, alpha 1 | 48 | 0.451 | 0.0941 | Yes |
| 2 | IL1A | IL1A StanfordSource, GeneCards | interleukin 1, alpha | 106 | 0.400 | 0.1760 | Yes |
| 3 | IL4 | IL4 StanfordSource, GeneCards | interleukin 4 | 206 | 0.354 | 0.2438 | Yes |
| 4 | CD4 | CD4 StanfordSource, GeneCards | CD4 antigen (p55) | 245 | 0.345 | 0.3155 | Yes |
| 5 | TNF | TNF StanfordSource, GeneCards | tumor necrosis factor (TNF superfamily, member 2) | 264 | 0.340 | 0.3882 | Yes |
| 6 | CSF3 | CSF3 StanfordSource, GeneCards | colony stimulating factor 3 (granulocyte) | 862 | 0.252 | 0.3841 | Yes |
| 7 | IFNB1 | IFNB1 StanfordSource, GeneCards | interferon, beta 1, fibroblast | 905 | 0.249 | 0.4344 | Yes |
| 8 | IL12A | IL12A StanfordSource, GeneCards | interleukin 12A (natural killer cell stimulatory factor 1, cytotoxic lymphocyte maturation factor 1, p35) | 1474 | 0.208 | 0.4237 | Yes |
| 9 | IFNG | IFNG StanfordSource, GeneCards | interferon, gamma | 1741 | 0.191 | 0.4390 | Yes |
| 10 | IL2 | IL2 StanfordSource, GeneCards | interleukin 2 | 1791 | 0.187 | 0.4752 | Yes |
| 11 | IL7 | IL7 StanfordSource, GeneCards | interleukin 7 | 2069 | 0.171 | 0.4852 | Yes |
| 12 | IL15 | IL15 StanfordSource, GeneCards | interleukin 15 | 2130 | 0.167 | 0.5159 | Yes |
| 13 | HLA-DRA | HLA-DRA StanfordSource, GeneCards | major histocompatibility complex, class II, DR alpha | 2306 | 0.157 | 0.5328 | Yes |
| 14 | IL3 | IL3 StanfordSource, GeneCards | interleukin 3 (colony-stimulating factor, multiple) | 2651 | 0.138 | 0.5289 | Yes |
| 15 | PDGFA | PDGFA StanfordSource, GeneCards | platelet-derived growth factor alpha polypeptide | 2795 | 0.131 | 0.5434 | Yes |
| 16 | IL10 | IL10 StanfordSource, GeneCards | interleukin 10 | 3211 | 0.111 | 0.5265 | No |
| 17 | IL8 | IL8 StanfordSource, GeneCards | interleukin 8 | 4421 | 0.056 | 0.4188 | No |
| 18 | IL5 | IL5 StanfordSource, GeneCards | interleukin 5 (colony-stimulating factor, eosinophil) | 4545 | 0.051 | 0.4177 | No |
| 19 | CSF1 | CSF1 StanfordSource, GeneCards | colony stimulating factor 1 (macrophage) | 4626 | 0.047 | 0.4202 | No |
| 20 | LTA | LTA StanfordSource, GeneCards | lymphotoxin alpha (TNF superfamily, member 1) | 5208 | 0.022 | 0.3674 | No |
| 21 | IL13 | IL13 StanfordSource, GeneCards | interleukin 13 | 5738 | -0.001 | 0.3152 | No |
| 22 | IL12B | IL12B StanfordSource, GeneCards | interleukin 12B (natural killer cell stimulatory factor 2, cytotoxic lymphocyte maturation factor 2, p40) | 6037 | -0.015 | 0.2888 | No |
| 23 | IL11 | IL11 StanfordSource, GeneCards | interleukin 11 | 6697 | -0.046 | 0.2334 | No |
| 24 | TGFB2 | TGFB2 StanfordSource, GeneCards | transforming growth factor, beta 2 | 7168 | -0.069 | 0.2019 | No |
| 25 | TGFB3 | TGFB3 StanfordSource, GeneCards | transforming growth factor, beta 3 | 7188 | -0.071 | 0.2155 | No |
| 26 | TGFB1 | TGFB1 StanfordSource, GeneCards | transforming growth factor, beta 1 (Camurati-Engelmann disease) | 7814 | -0.105 | 0.1764 | No |
| 27 | CSF2 | CSF2 StanfordSource, GeneCards | colony stimulating factor 2 (granulocyte-macrophage) | 8002 | -0.114 | 0.1828 | No |
| 28 | IL6 | IL6 StanfordSource, GeneCards | interleukin 6 (interferon, beta 2) | 8024 | -0.115 | 0.2060 | No |