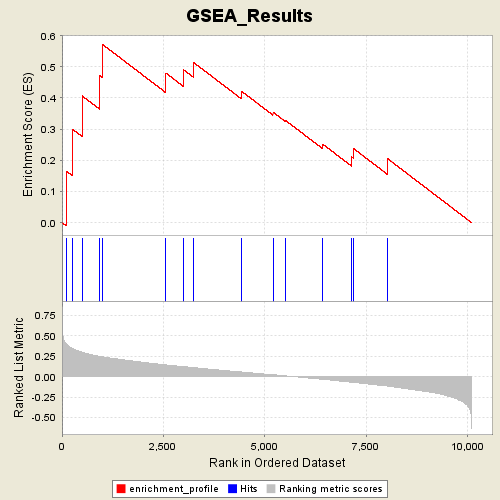
Profile of the Running ES Score & Positions of GeneSet Members on the Rank Ordered List
| Dataset | p53_full_useme_maxed_cs.gct |
| Phenotype | WT |
| GeneSet | s2.symbols.gmt#lairPathway |
| Enrichment Score (ES) | 0.5720317 |
| Normalized Enrichment Score (NES) | 1.497634 |
| Nominal p-value | 0.05719921 |
| FDR q-value | 0.70921886 |
| FWER p-Value | 0.986 |
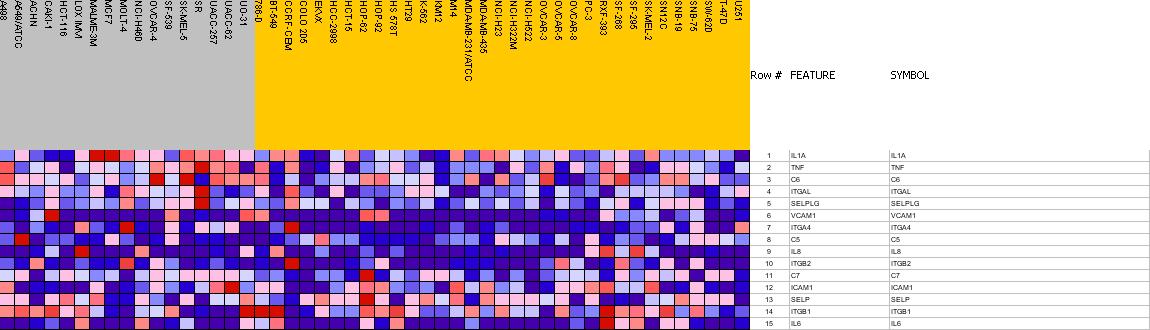
| PROBE | GENE SYMBOL | GENE_TITLE | RANK IN GENE LIST | RANK METRIC SCORE | RES | CORE_ENRICHMENT | |
|---|---|---|---|---|---|---|---|
| 1 | IL1A | IL1A StanfordSource, GeneCards | interleukin 1, alpha | 106 | 0.400 | 0.1652 | Yes |
| 2 | TNF | TNF StanfordSource, GeneCards | tumor necrosis factor (TNF superfamily, member 2) | 264 | 0.340 | 0.2990 | Yes |
| 3 | C6 | C6 StanfordSource, GeneCards | complement component 6 | 499 | 0.297 | 0.4064 | Yes |
| 4 | ITGAL | ITGAL StanfordSource, GeneCards | integrin, alpha L (antigen CD11A (p180), lymphocyte function-associated antigen 1; alpha polypeptide) | 925 | 0.247 | 0.4729 | Yes |
| 5 | SELPLG | SELPLG StanfordSource, GeneCards | selectin P ligand | 996 | 0.241 | 0.5720 | Yes |
| 6 | VCAM1 | VCAM1 StanfordSource, GeneCards | vascular cell adhesion molecule 1 | 2562 | 0.143 | 0.4798 | No |
| 7 | ITGA4 | ITGA4 StanfordSource, GeneCards | integrin, alpha 4 (antigen CD49D, alpha 4 subunit of VLA-4 receptor) | 2990 | 0.122 | 0.4911 | No |
| 8 | C5 | C5 StanfordSource, GeneCards | complement component 5 | 3247 | 0.109 | 0.5136 | No |
| 9 | IL8 | IL8 StanfordSource, GeneCards | interleukin 8 | 4421 | 0.056 | 0.4221 | No |
| 10 | ITGB2 | ITGB2 StanfordSource, GeneCards | integrin, beta 2 (antigen CD18 (p95), lymphocyte function-associated antigen 1; macrophage antigen 1 (mac-1) beta subunit) | 5204 | 0.022 | 0.3544 | No |
| 11 | C7 | C7 StanfordSource, GeneCards | complement component 7 | 5514 | 0.009 | 0.3277 | No |
| 12 | ICAM1 | ICAM1 StanfordSource, GeneCards | intercellular adhesion molecule 1 (CD54), human rhinovirus receptor | 6431 | -0.034 | 0.2516 | No |
| 13 | SELP | SELP StanfordSource, GeneCards | selectin P (granule membrane protein 140kDa, antigen CD62) | 7145 | -0.068 | 0.2109 | No |
| 14 | ITGB1 | ITGB1 StanfordSource, GeneCards | integrin, beta 1 (fibronectin receptor, beta polypeptide, antigen CD29 includes MDF2, MSK12) | 7190 | -0.071 | 0.2376 | No |
| 15 | IL6 | IL6 StanfordSource, GeneCards | interleukin 6 (interferon, beta 2) | 8024 | -0.115 | 0.2058 | No |