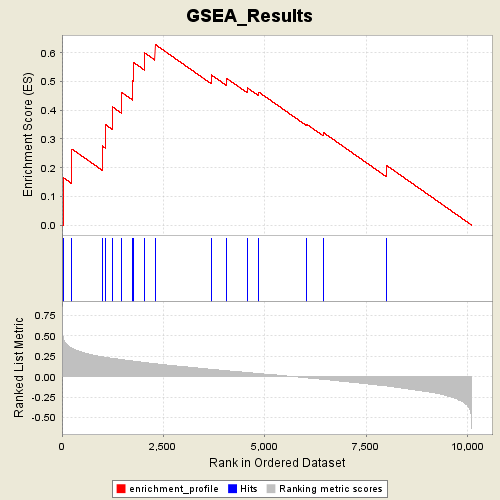
Profile of the Running ES Score & Positions of GeneSet Members on the Rank Ordered List
| Dataset | p53_full_useme_maxed_cs.gct |
| Phenotype | WT |
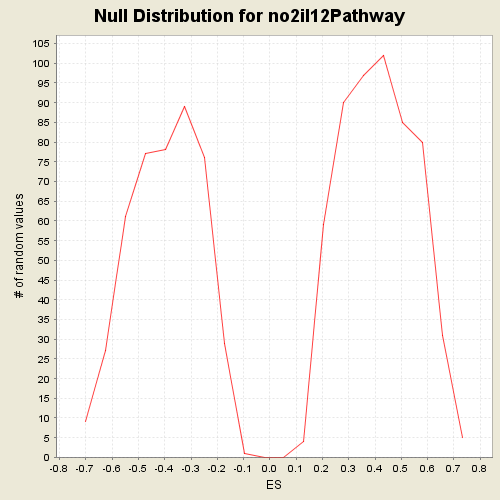
| GeneSet | s2.symbols.gmt#no2il12Pathway |
| Enrichment Score (ES) | 0.62922 |
| Normalized Enrichment Score (NES) | 1.5182602 |
| Nominal p-value | 0.048824593 |
| FDR q-value | 0.7759864 |
| FWER p-Value | 0.975 |
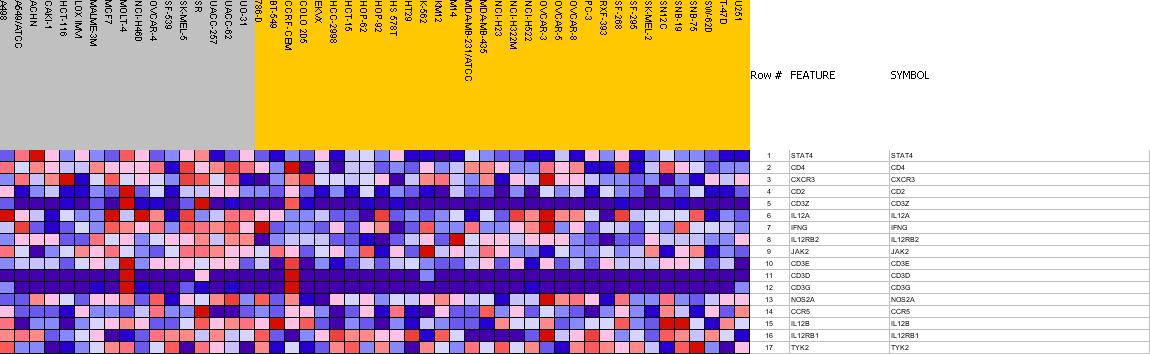
| PROBE | GENE SYMBOL | GENE_TITLE | RANK IN GENE LIST | RANK METRIC SCORE | RES | CORE_ENRICHMENT | |
|---|---|---|---|---|---|---|---|
| 1 | STAT4 | STAT4 StanfordSource, GeneCards | signal transducer and activator of transcription 4 | 31 | 0.480 | 0.1651 | Yes |
| 2 | CD4 | CD4 StanfordSource, GeneCards | CD4 antigen (p55) | 245 | 0.345 | 0.2646 | Yes |
| 3 | CXCR3 | CXCR3 StanfordSource, GeneCards | chemokine (C-X-C motif) receptor 3 | 992 | 0.242 | 0.2753 | Yes |
| 4 | CD2 | CD2 StanfordSource, GeneCards | CD2 antigen (p50), sheep red blood cell receptor | 1072 | 0.235 | 0.3499 | Yes |
| 5 | CD3Z | CD3Z StanfordSource, GeneCards | CD3Z antigen, zeta polypeptide (TiT3 complex) | 1238 | 0.224 | 0.4119 | Yes |
| 6 | IL12A | IL12A StanfordSource, GeneCards | interleukin 12A (natural killer cell stimulatory factor 1, cytotoxic lymphocyte maturation factor 1, p35) | 1474 | 0.208 | 0.4616 | Yes |
| 7 | IFNG | IFNG StanfordSource, GeneCards | interferon, gamma | 1741 | 0.191 | 0.5020 | Yes |
| 8 | IL12RB2 | IL12RB2 StanfordSource, GeneCards | interleukin 12 receptor, beta 2 | 1761 | 0.189 | 0.5663 | Yes |
| 9 | JAK2 | JAK2 StanfordSource, GeneCards | Janus kinase 2 (a protein tyrosine kinase) | 2039 | 0.173 | 0.5994 | Yes |
| 10 | CD3E | CD3E StanfordSource, GeneCards | CD3E antigen, epsilon polypeptide (TiT3 complex) | 2294 | 0.157 | 0.6292 | Yes |
| 11 | CD3D | CD3D StanfordSource, GeneCards | CD3D antigen, delta polypeptide (TiT3 complex) | 3686 | 0.089 | 0.5224 | No |
| 12 | CD3G | CD3G StanfordSource, GeneCards | CD3G antigen, gamma polypeptide (TiT3 complex) | 4050 | 0.072 | 0.5117 | No |
| 13 | NOS2A | NOS2A StanfordSource, GeneCards | nitric oxide synthase 2A (inducible, hepatocytes) | 4572 | 0.050 | 0.4775 | No |
| 14 | CCR5 | CCR5 StanfordSource, GeneCards | chemokine (C-C motif) receptor 5 | 4854 | 0.037 | 0.4627 | No |
| 15 | IL12B | IL12B StanfordSource, GeneCards | interleukin 12B (natural killer cell stimulatory factor 2, cytotoxic lymphocyte maturation factor 2, p40) | 6037 | -0.015 | 0.3506 | No |
| 16 | IL12RB1 | IL12RB1 StanfordSource, GeneCards | interleukin 12 receptor, beta 1 | 6444 | -0.034 | 0.3223 | No |
| 17 | TYK2 | TYK2 StanfordSource, GeneCards | tyrosine kinase 2 | 8006 | -0.114 | 0.2076 | No |