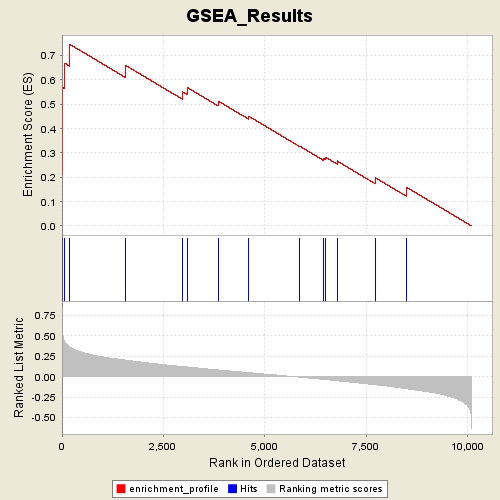
Profile of the Running ES Score & Positions of GeneSet Members on the Rank Ordered List
| Dataset | p53_full_useme_maxed_cs.gct |
| Phenotype | WT |
| GeneSet | s2.symbols.gmt#p53Pathway |
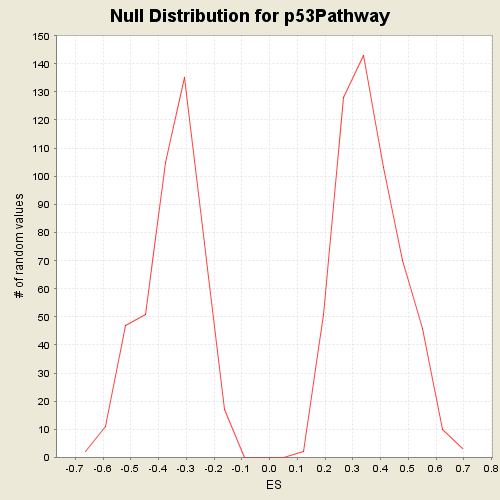
| Enrichment Score (ES) | 0.7459421 |
| Normalized Enrichment Score (NES) | 2.0595584 |
| Nominal p-value | 0.0 |
| FDR q-value | 0.009290409 |
| FWER p-Value | 0.018 |
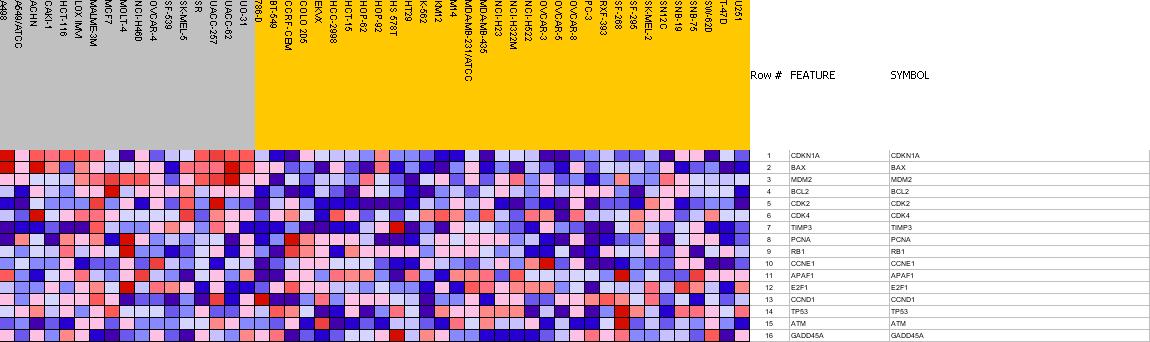
| PROBE | GENE SYMBOL | GENE_TITLE | RANK IN GENE LIST | RANK METRIC SCORE | RES | CORE_ENRICHMENT | |
|---|---|---|---|---|---|---|---|
| 1 | CDKN1A | CDKN1A StanfordSource, GeneCards | cyclin-dependent kinase inhibitor 1A (p21, Cip1) | 0 | 0.843 | 0.2092 | Yes |
| 2 | BAX | BAX StanfordSource, GeneCards | BCL2-associated X protein | 1 | 0.823 | 0.4137 | Yes |
| 3 | MDM2 | MDM2 StanfordSource, GeneCards | Mdm2, transformed 3T3 cell double minute 2, p53 binding protein (mouse) | 2 | 0.631 | 0.5703 | Yes |
| 4 | BCL2 | BCL2 StanfordSource, GeneCards | B-cell CLL/lymphoma 2 | 71 | 0.420 | 0.6678 | Yes |
| 5 | CDK2 | CDK2 StanfordSource, GeneCards | cyclin-dependent kinase 2 | 190 | 0.362 | 0.7459 | Yes |
| 6 | CDK4 | CDK4 StanfordSource, GeneCards | cyclin-dependent kinase 4 | 1577 | 0.201 | 0.6584 | No |
| 7 | TIMP3 | TIMP3 StanfordSource, GeneCards | tissue inhibitor of metalloproteinase 3 (Sorsby fundus dystrophy, pseudoinflammatory) | 2968 | 0.123 | 0.5511 | No |
| 8 | PCNA | PCNA StanfordSource, GeneCards | proliferating cell nuclear antigen | 3090 | 0.117 | 0.5682 | No |
| 9 | RB1 | RB1 StanfordSource, GeneCards | retinoblastoma 1 (including osteosarcoma) | 3854 | 0.081 | 0.5127 | No |
| 10 | CCNE1 | CCNE1 StanfordSource, GeneCards | cyclin E1 | 4602 | 0.049 | 0.4507 | No |
| 11 | APAF1 | APAF1 StanfordSource, GeneCards | apoptotic protease activating factor | 5864 | -0.007 | 0.3274 | No |
| 12 | E2F1 | E2F1 StanfordSource, GeneCards | E2F transcription factor 1 | 6448 | -0.034 | 0.2781 | No |
| 13 | CCND1 | CCND1 StanfordSource, GeneCards | cyclin D1 (PRAD1: parathyroid adenomatosis 1) | 6506 | -0.037 | 0.2816 | No |
| 14 | TP53 | TP53 StanfordSource, GeneCards | tumor protein p53 (Li-Fraumeni syndrome) | 6783 | -0.050 | 0.2667 | No |
| 15 | ATM | ATM StanfordSource, GeneCards | ataxia telangiectasia mutated (includes complementation groups A, C and D) | 7735 | -0.100 | 0.1972 | No |
| 16 | GADD45A | GADD45A StanfordSource, GeneCards | growth arrest and DNA-damage-inducible, alpha | 8507 | -0.149 | 0.1579 | No |