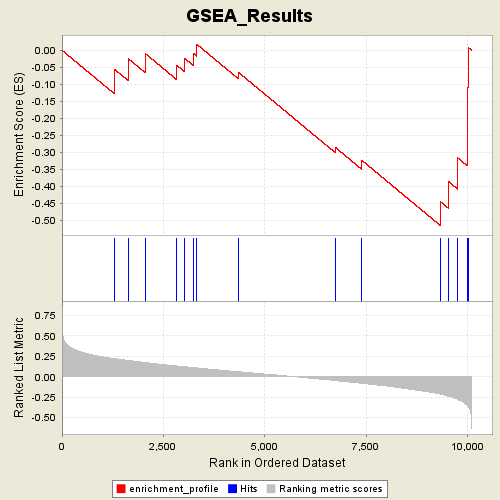
Profile of the Running ES Score & Positions of GeneSet Members on the Rank Ordered List
| Dataset | p53_full_useme_maxed_cs.gct |
| Phenotype | MUT |
| GeneSet | s2.symbols.gmt#pitx2Pathway |
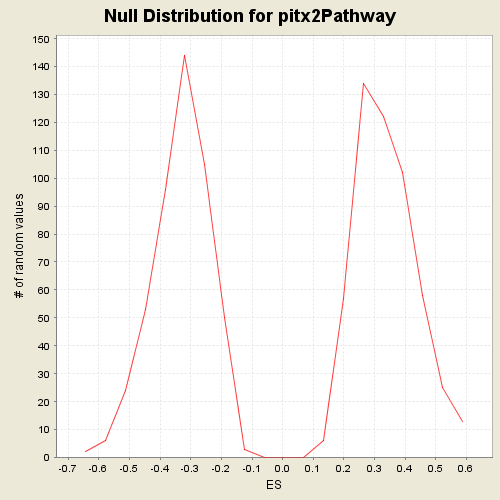
| Enrichment Score (ES) | -0.51732284 |
| Normalized Enrichment Score (NES) | -1.5509864 |
| Nominal p-value | 0.024844721 |
| FDR q-value | 0.53344524 |
| FWER p-Value | 0.93 |
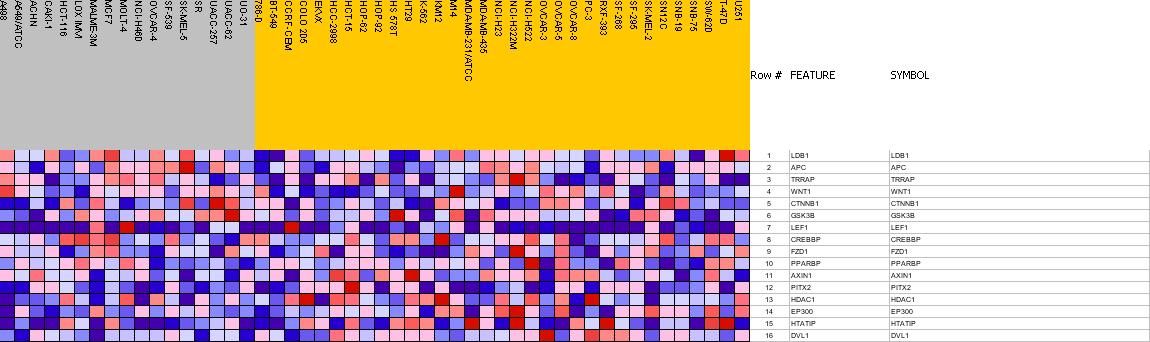
| PROBE | GENE SYMBOL | GENE_TITLE | RANK IN GENE LIST | RANK METRIC SCORE | RES | CORE_ENRICHMENT | |
|---|---|---|---|---|---|---|---|
| 1 | LDB1 | LDB1 StanfordSource, GeneCards | LIM domain binding 1 | 1296 | 0.220 | -0.0562 | No |
| 2 | APC | APC StanfordSource, GeneCards | adenomatosis polyposis coli | 1633 | 0.198 | -0.0245 | No |
| 3 | TRRAP | TRRAP StanfordSource, GeneCards | transformation/transcription domain-associated protein | 2060 | 0.172 | -0.0103 | No |
| 4 | WNT1 | WNT1 StanfordSource, GeneCards | wingless-type MMTV integration site family, member 1 | 2825 | 0.129 | -0.0436 | No |
| 5 | CTNNB1 | CTNNB1 StanfordSource, GeneCards | catenin (cadherin-associated protein), beta 1, 88kDa | 3019 | 0.121 | -0.0230 | No |
| 6 | GSK3B | GSK3B StanfordSource, GeneCards | glycogen synthase kinase 3 beta | 3246 | 0.109 | -0.0096 | No |
| 7 | LEF1 | LEF1 StanfordSource, GeneCards | lymphoid enhancer-binding factor 1 | 3325 | 0.106 | 0.0175 | No |
| 8 | CREBBP | CREBBP StanfordSource, GeneCards | CREB binding protein (Rubinstein-Taybi syndrome) | 4356 | 0.059 | -0.0654 | No |
| 9 | FZD1 | FZD1 StanfordSource, GeneCards | frizzled homolog 1 (Drosophila) | 6734 | -0.048 | -0.2854 | No |
| 10 | PPARBP | PPARBP StanfordSource, GeneCards | PPAR binding protein | 7389 | -0.081 | -0.3236 | No |
| 11 | AXIN1 | AXIN1 StanfordSource, GeneCards | axin 1 | 9343 | -0.215 | -0.4468 | Yes |
| 12 | PITX2 | PITX2 StanfordSource, GeneCards | paired-like homeodomain transcription factor 2 | 9536 | -0.240 | -0.3870 | Yes |
| 13 | HDAC1 | HDAC1 StanfordSource, GeneCards | histone deacetylase 1 | 9762 | -0.280 | -0.3172 | Yes |
| 14 | EP300 | EP300 StanfordSource, GeneCards | E1A binding protein p300 | 9993 | -0.349 | -0.2252 | Yes |
| 15 | HTATIP | HTATIP StanfordSource, GeneCards | HIV-1 Tat interactive protein, 60kDa | 10002 | -0.356 | -0.1091 | Yes |
| 16 | DVL1 | DVL1 StanfordSource, GeneCards | dishevelled, dsh homolog 1 (Drosophila) | 10014 | -0.361 | 0.0084 | Yes |