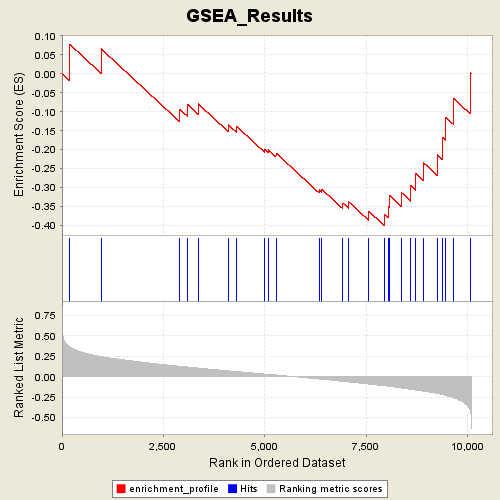
Profile of the Running ES Score & Positions of GeneSet Members on the Rank Ordered List
| Dataset | p53_full_useme_maxed_cs.gct |
| Phenotype | MUT |
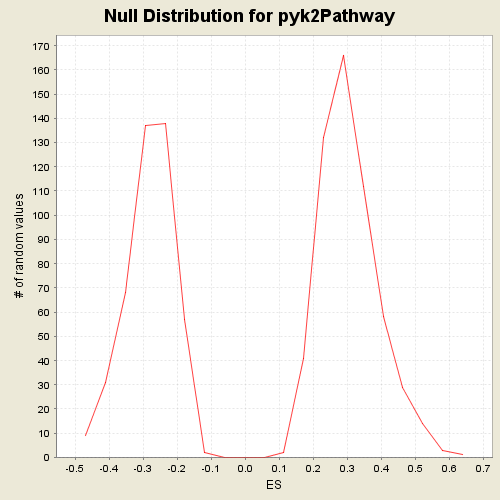
| GeneSet | s2.symbols.gmt#pyk2Pathway |
| Enrichment Score (ES) | -0.4015044 |
| Normalized Enrichment Score (NES) | -1.4219795 |
| Nominal p-value | 0.056561086 |
| FDR q-value | 0.649132 |
| FWER p-Value | 0.994 |
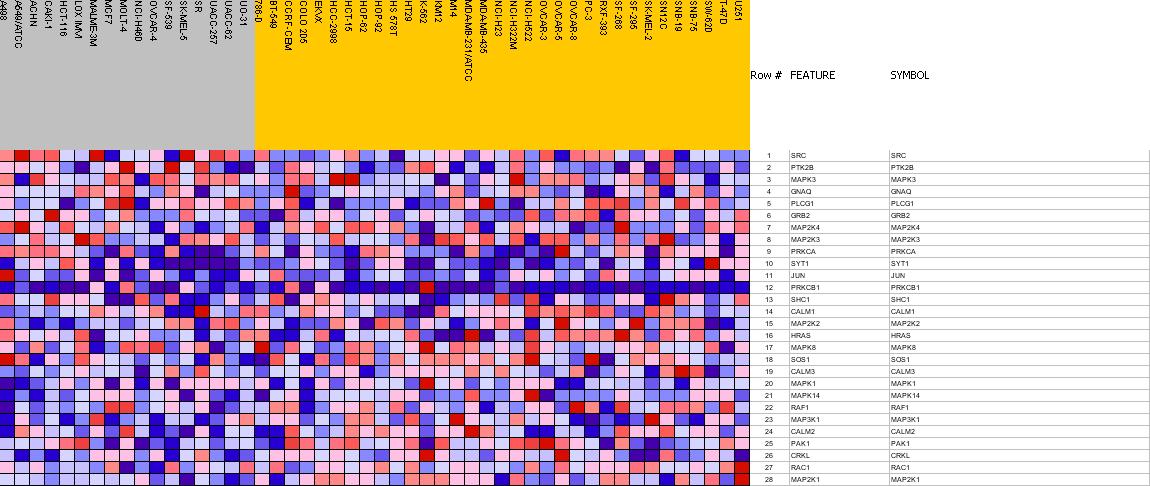
| PROBE | GENE SYMBOL | GENE_TITLE | RANK IN GENE LIST | RANK METRIC SCORE | RES | CORE_ENRICHMENT | |
|---|---|---|---|---|---|---|---|
| 1 | SRC | SRC StanfordSource, GeneCards | v-src sarcoma (Schmidt-Ruppin A-2) viral oncogene homolog (avian) | 191 | 0.362 | 0.0774 | No |
| 2 | PTK2B | PTK2B StanfordSource, GeneCards | PTK2B protein tyrosine kinase 2 beta | 967 | 0.243 | 0.0652 | No |
| 3 | MAPK3 | MAPK3 StanfordSource, GeneCards | mitogen-activated protein kinase 3 | 2905 | 0.125 | -0.0937 | No |
| 4 | GNAQ | GNAQ StanfordSource, GeneCards | guanine nucleotide binding protein (G protein), q polypeptide | 3093 | 0.117 | -0.0811 | No |
| 5 | PLCG1 | PLCG1 StanfordSource, GeneCards | phospholipase C, gamma 1 (formerly subtype 148) | 3357 | 0.105 | -0.0794 | No |
| 6 | GRB2 | GRB2 StanfordSource, GeneCards | growth factor receptor-bound protein 2 | 4102 | 0.070 | -0.1347 | No |
| 7 | MAP2K4 | MAP2K4 StanfordSource, GeneCards | mitogen-activated protein kinase kinase 4 | 4310 | 0.060 | -0.1392 | No |
| 8 | MAP2K3 | MAP2K3 StanfordSource, GeneCards | mitogen-activated protein kinase kinase 3 | 4998 | 0.031 | -0.1992 | No |
| 9 | PRKCA | PRKCA StanfordSource, GeneCards | protein kinase C, alpha | 5086 | 0.027 | -0.2007 | No |
| 10 | SYT1 | SYT1 StanfordSource, GeneCards | synaptotagmin I | 5278 | 0.020 | -0.2144 | No |
| 11 | JUN | JUN StanfordSource, GeneCards | v-jun sarcoma virus 17 oncogene homolog (avian) | 5283 | 0.019 | -0.2096 | No |
| 12 | PRKCB1 | PRKCB1 StanfordSource, GeneCards | protein kinase C, beta 1 | 6340 | -0.029 | -0.3067 | No |
| 13 | SHC1 | SHC1 StanfordSource, GeneCards | SHC (Src homology 2 domain containing) transforming protein 1 | 6401 | -0.032 | -0.3042 | No |
| 14 | CALM1 | CALM1 StanfordSource, GeneCards | calmodulin 1 (phosphorylase kinase, delta) | 6929 | -0.058 | -0.3411 | No |
| 15 | MAP2K2 | MAP2K2 StanfordSource, GeneCards | mitogen-activated protein kinase kinase 2 | 7065 | -0.065 | -0.3373 | No |
| 16 | HRAS | HRAS StanfordSource, GeneCards | v-Ha-ras Harvey rat sarcoma viral oncogene homolog | 7563 | -0.090 | -0.3626 | No |
| 17 | MAPK8 | MAPK8 StanfordSource, GeneCards | mitogen-activated protein kinase 8 | 7956 | -0.112 | -0.3717 | Yes |
| 18 | SOS1 | SOS1 StanfordSource, GeneCards | son of sevenless homolog 1 (Drosophila) | 8043 | -0.116 | -0.3493 | Yes |
| 19 | CALM3 | CALM3 StanfordSource, GeneCards | calmodulin 3 (phosphorylase kinase, delta) | 8068 | -0.118 | -0.3203 | Yes |
| 20 | MAPK1 | MAPK1 StanfordSource, GeneCards | mitogen-activated protein kinase 1 | 8361 | -0.139 | -0.3123 | Yes |
| 21 | MAPK14 | MAPK14 StanfordSource, GeneCards | mitogen-activated protein kinase 14 | 8605 | -0.156 | -0.2948 | Yes |
| 22 | RAF1 | RAF1 StanfordSource, GeneCards | v-raf-1 murine leukemia viral oncogene homolog 1 | 8728 | -0.164 | -0.2633 | Yes |
| 23 | MAP3K1 | MAP3K1 StanfordSource, GeneCards | mitogen-activated protein kinase kinase kinase 1 | 8906 | -0.177 | -0.2338 | Yes |
| 24 | CALM2 | CALM2 StanfordSource, GeneCards | calmodulin 2 (phosphorylase kinase, delta) | 9251 | -0.205 | -0.2134 | Yes |
| 25 | PAK1 | PAK1 StanfordSource, GeneCards | p21/Cdc42/Rac1-activated kinase 1 (STE20 homolog, yeast) | 9376 | -0.218 | -0.1675 | Yes |
| 26 | CRKL | CRKL StanfordSource, GeneCards | v-crk sarcoma virus CT10 oncogene homolog (avian)-like | 9465 | -0.230 | -0.1150 | Yes |
| 27 | RAC1 | RAC1 StanfordSource, GeneCards | ras-related C3 botulinum toxin substrate 1 (rho family, small GTP binding protein Rac1) | 9657 | -0.258 | -0.0654 | Yes |
| 28 | MAP2K1 | MAP2K1 StanfordSource, GeneCards | mitogen-activated protein kinase kinase 1 | 10067 | -0.410 | 0.0032 | Yes |